
Introduction
As a Microsoft-certified Dynamics NAV Upgrade Center, we see a lot of upgrades at Liberty Grove Software. In recent years, those upgrades have been to NAV 2009. Increasingly, with the end of NAV classic reporting now in sight, many of our upgrades have involved the conversion of classic reports to their RDLC equivalents.
For those readers not involved in the technical side of Dynamics NAV, RDLC stands for “Report Definition Language Client”. RDLC is part of Microsoft’s SQL Server Reporting Services toolset and it is the new standard technology for Dynamics NAV reporting. RDLC and classic reports are supported in tandem in NAV 2009, but in NAV 2013 only RDLC reports will be available. So if you’ve already made the move to NAV 2009, read on to understand why you’re in a great position to do your Classic-to-RDLC migration now. If you’re planning a NAV upgrade to 2009 or 2013, it is important to understand the report conversion process in order to invest your upgrade dollars wisely.
Understanding Your Report Upgrade Circumstances
If your company uses only Dynamics NAV standard reports, or standard reports with only minor modifications, you don’t need to read the rest of this article. Microsoft provides RDLC versions of all its standard reports out of the box.
The only caveat here is that, if you’ve made minor customizations to standard reports, do not attempt to retain these customizations by carrying your versions of the reports forward in the upgrade process and expecting Microsoft’s Create Layout Suggestion tool to make everything right. If you do this, you’ll overwrite all the manual work Microsoft did to fix up the RDLC versions of their standard reports, which will cause you a lot of grief. You’re much better off to manually reapply your minor customizations to the standard Microsoft RDLC reports instead.
You also don’t need to devote special attention to the report portion of your upgrade if you have only simple custom reports (i.e. lists). In this case, the Create Layout Suggestion tool will help, not hinder, and the total time required for such conversions will be minimal.
If, however, you have complex custom reports, especially if you have a lot of them, you should seriously consider making their conversion a separate project. As with any upgrade, the fewer changes you try to pack into one project (or one phase of a project), the better your chances of completing it on time, on budget, and without any significant problems.
Because they are generally independent units of code, reports are ideal candidates for this divide-and-conquer strategy. But there’s a much bigger reason to take this approach, and it has to do with quality of review.
Put Your Money on the Turtle, Not the Hare
When faced with a large body of work, most of us like to tackle it as quickly and intensely as we can, mainly to get ourselves over the hump.But when tasked with converting a large number of complex reports, it’s actually much better to take a slower approach, and the reason has to do with the completeness of each report upgrade and the quality of review.
If you ask your staff to review a large number of complex, completely rewritten reports in a short period of time, they’ll likely take a rubber stamp approach to the review process. That’s human nature.
Yet, if you’ve gone to the trouble of creating complex reports in the first place, not to mention paying to have them rewritten, they’re probably important to you. They probably play a key role in decision-making across your company.
Besides, if you’re on NAV 2009, you can still use the classic version of your reports while you create your RDLC equivalents. So go slow, convert and review one report at a time, and give your staff the time they need to get it right. This is especially true if your reports have many options and filters, which require a lot more time to test properly. The alternative is to rush things and risk running your company on potentially erroneous information.
The Problem With Microsoft’s RDLC Conversion Tool
So, why do you have to worry about rewriting all your complex custom reports in the first place, instead of using Microsoft’s Create Layout Suggestion tool to do it for you? The simple answer is, for reports with any degree of complexity, the tool doesn’t work. It’s not really Microsoft’s fault, either. The fact is, classic NAV reports and RDLC reports use completely different technologies, and are built on highly divergent paradigms. Automatically converting complex reports from one to the other is a tall order. So you’re going to need a programmer, which brings us to…
Resourcing Your Project
If, as you contemplate how you’re going to resource your report upgrade project, you find yourself thinking, “These are just reports. How hard can it be?”, and a picture pops into your head of that student programmer you just hired for the summer, think again. Rewriting a report created in one technology into the equivalent report in a completely different technology, especially if the report is not properly documented, is not a task for the inexperienced. It’s the subtle errors that will get you (such as a report that functions correctly in all circumstances except one), and inexperienced programmers are sometimes vulnerable to subtleties.
Assigning the conversion project to someone who has a lot of other tasks on his or her plate isn’t a good idea, either. Rewriting complex custom reports is a detailed, methodical, often monotonous task – not the type of work you can do with a lot of interruptions.
For these reasons, you should also consider using an official NAV upgrade center to do the work. There’s nothing like repetition to hone one’s skills at specific tasks, especially if the upgrade center has programmers who specialize in RDLC upgrades.
For more information on the technical aspects of converting classic reports to their RDLC counterparts, see the series of posts that starts here: Converting Classic Reports To Rdlc Part 1.
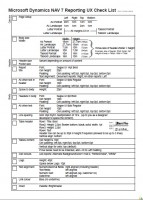
This early draft of NAV 2013 RDLC reporting guidelines was placed on the Microsoft Dynamics NAV Team Blog earlier in the year. As the original author notes, they’re essentially “a checklist at this point, which you can go through one by one. For example, it is a good practice to define the Page Width, Page Height, and margins in the Report Properties before starting to design your report.”https://libertygrove.com/wp-content/uploads/attachments/microsoft-dynamics-nav-rdlc-reporting-guidelines.pdf
He also notes that not all checks necessarily apply to all report types.
To assist you in understanding the guidelines, a series of instructional videos was placed on YouTube. Here a few of those videos:
You can view the complete set of videos here: Dynamics NAV 2013 Draft RDLC Reporting Guidelines.
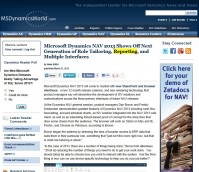
At Convergence 2012, Microsoft finally announced the official name for NAV 7, now called “Dynamics NAV 2013”.
The official press release can be found here at the Microsoft News Center.
A far more informative article (no offense to Microsoft) was written by MSDynamicsWorld.com, entitled Microsoft Dynamics NAV 2013 Shows Off Next Generation of Role Tailoring, Reporting, and Multiple Interfaces.
As the title implies, this article walks you through a number of NAV 2013’s new features including interface enhancements/options, new reporting features, device-specific technology, and an exciting “proof of concept demonstration using Kinect and a custom Metro UI to control shop floor assembly work”.
It’s a well-written overview of many of NAV’s new features, and well worth the five minutes it takes to read it.
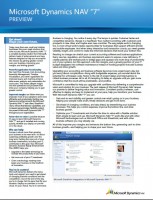
Curious about NAV 2013’s new features? Microsoft has released a NAV 2013 fact sheet for end-use customers. New features include:
- Enhanced cost accounting and new cash-flow forecast capabilities;
- •A new Assembly Management feature that allows companies to meet customer needs through assemble-to-order and assemble-to-stock processes;
- Greatly expanded reporting capabilities via KPI visualizations, Excel and PowerPivot, and other Microsoft reporting and presentation technologies;
- Improved planning capabilities;
- RoleTailored improvements in querying, charting, and grouping information;
- The ability to extend NAV’s reach further into the SharePoint and web browser domains;
…and more. See the Dynamics NAV 2013 Preview Fact Sheet for the official release.
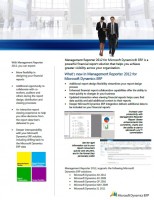
Management Reporter 2012 was recently released and integrated with Microsoft Dynamics NAV 2009 R2. Over the next few months, we’ll be writing a number of blogs on Management Reporter 2012 features, including:
• depth of integration with the NAV financial data;
• drill-through capabilities into operational data;
• graphing/charting;
• advanced reports;
• publishing and sharing your reports with others;
• performance;
We’ll also be comparing and contrasting Management Reporter 2012’s capabilities and report-building efficiency with NAV’s classic reporting toolset, RDLC reporting, and full-blown SSRS reporting (i.e. accessing NAV data from SSRS directly through SQL Server or a cube).
In the meantime, as a quick preview, here’s a look at the Management Reporter 2012 Fact Sheet.
An Inevitable Conversion
As Microsoft has already announced, Dynamics NAV 2013 will run only RDLC reports and will discontinue the use of NAV classic reports. This means all customers upgrading to NAV 2013 will have to convert their classic reports to the RDLC format.
Some will undoubtedly dislike this forced conversion, but we believe it’s an opportunity for NAV customers to greatly enhance their reporting capabilities, not only for NAV 2013, but also for NAV 2009, where RDLC reports are optional.
What is RDLC?
RDLC stands for “Report Definition Language Client-side”, an XML markup language used by Microsoft’s Visual Studio to define and store report definitions.
RDLC reports are rendered by a .Net control called Report Viewer, which can be embedded in .Net applications.
The Report Viewer does not play a part in retrieving data; it merely formats and presents the data supplied by its host application. This all happens locally, i.e. on the client, which explains the “Client-side” portion of RDLC’s full name.
Dynamics NAV acts as the host application for the RDLC Report Viewer. It is therefore up to NAV to retrieve the data and supply it to the Report Viewer along with the RDLC report definition.
How does NAV retrieve the reporting data? First, let’s take a look at the existing situation in NAV 2009 R2.
RDLC in NAV 2009 R2
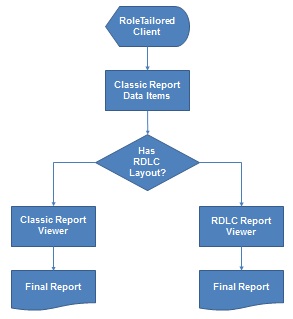
When you run a report from NAV’s classic client, it will be a classic report – no exceptions – which means NAV will process the classic data items and the classic layout in concert to render the report in the classic report viewer.
When you run a report from the RoleTailored Client (RTC), the first thing NAV must do is determine if the report has an RDLC layout. If it does not, NAV will invoke classic client functionality to run the classic version of the report.
If the report does have an RDLC layout, NAV will still use the classic data items, but, in this case, it will retrieve all the data first, flatten it into one dataset, then hand both the flattened dataset and the RDLC layout off to the RDLC Report Viewer for rendering. Note, none of the classic report code beyond the data items will be processed (i.e. none of the code in the report section triggers will fire):
Note, also, that only data item fields placed in one of the sections of the classic report will make its way into the dataset for the RDLC report.
RDLC in NAV 2013
In NAV 2013, there won’t be any classic reports, so NAV will presumably retrieve and process the data using some other mechanism (word is the old classic report object will become strictly a dataset designer, but we’re waiting until we get my hands on the final version of NAV 2013 to verify). And, as mentioned, the only way to render reports will be via the RDLC Report Viewer.
The RDLC in NAV 2013 will upgraded to the 2008 version, which will add even more reporting functionality to its already impressive toolset.
However, Microsoft has announced that customers cannot upgrade directly to NAV 2013. They must go through NAV 2009. So the remaining parts of this article will focus entirely on converting reports to the RDLC in 2009 R2.
RDLC vs RDL
Just to avoid any confusion, we’ll finish today’s article by clarifying the differences between RDLC and RDL.
RDL is the report definition language used by Sequel Server Reporting Services (SSRS), Microsoft’s powerful server-based reporting engine. RDL files are created by SQL Server’s Business Intelligence Studio, which is a specialized implementation of Visual Studio geared toward BI projects.
RDL and RDLC are close cousins. For example, they share the same XML schema. But, as mentioned, RDLC files contain none of the information required to retrieve data. This gives them the flexibility required for use in general applications, where data may sometimes come from a program or other non-standard data source.
Next Post
Now that we’ve gotten the background information out of the way, part 2 of this article will look at the basic process of converting classic reports to RDLC.
The Basic Report Conversion Process
First, we might as well be up-front: the basic process of converting Dynamics NAV classic reports to RDLC layouts is clunky, time-consuming, and somewhat error-prone. This is caused in large part because you have to repeatedly work back and forth between the NAV classic report designer and the Visual Studio report designer (if you don’t understand why, see Converting Dynamics NAV Classic Reports To RDLC – Part 1).
The best way to demonstrate this is with a walk-through of the simplest possible report: a two-column (Code and Name) list of salespeople that looks like this in the classic Print Preview:
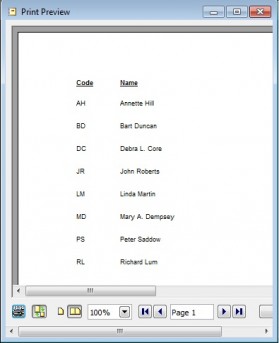
The report has no true header or footer, no global variables or C/AL code, no hidden fields – no complications whatsoever. It also has no RDLC layout, meaning it can only be run in the NAV classic client.
To create an RDLC layout, you have to first open the report in the classic report designer. NAV then provides us with two menu options:
- View->Layout; or
- Tools->Create Layout Suggestion.
If you choose View->Layout, NAV will either open the report’s existing RDLC layout, if one exists, or create a new blank RDLC layout.
If you choose Tools->Create Layout Suggestion, NAV will attempt to create a new RDLC layout based on the report’s classic layout, overwriting the existing RDLC layout, if any (though it will first request your permission to do so).
In either case, NAV will launch the Visual Studio Report Designer and load the RDCL layout in effect. For now, choose option # 2, the Create Layout Suggestion, which should result in the following Visual Studio Report Designer screen:
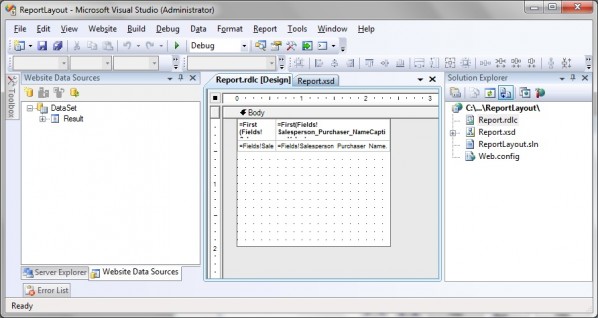
Naturally, the first thing you’ll want to check is how the report looks with its new RDLC layout, but here you run into your first challenge: there’s no way to preview the report from this environment. What you have to do instead is:
- Click File->Save Report.rdlc in the Visual Studio Report Designer.
- Switch back to the data items form of the classic report designer.
- Click the data items form, giving it focus (that’s the trigger for the next step in the process).
NAV will then respond with the following form:
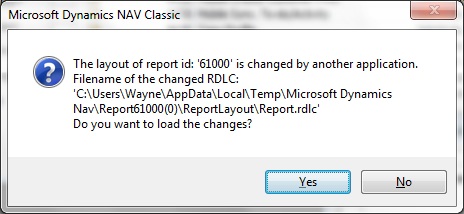
Click “Yes” to this question.
What are you answering “yes” to? You’re loading the RDLC layout saved in the Visual Studio Report Designer into the classic report object.
Loading is not the same as saving and compiling, however, so if you want to properly complete the process, you will have to click File->Save in the NAV classic report designer and make sure the “Compiled” box is checked.
Where’s your RDLC report preview? Still not there yet. To this point, all we’ve done is ensure that the RDLC layout we saved in Visual Studio is the same as the one we’ve saved in the NAV report object, i.e. we’ve put them in sync.
With your report properly saved, you have to type the following at the Windows command prompt: “DynamicsNAV:////runreport?report=XXXXX”, where you replace “XXXXX” with your report ID. Note, this form of the command is dependent on the availability of a local service tier. If you’re missing said tier, you’ll have to run a more specific form of the command, as follows: DynamicsNAV://server/service/company/runreport?report=XXXXX, where you replace the bolded elements with your NAV server name, service, and company, in addition to providing the correct report ID.
Do all this correctly and you will be rewarded with the RDLC Report Viewer preview of your report, as follows:
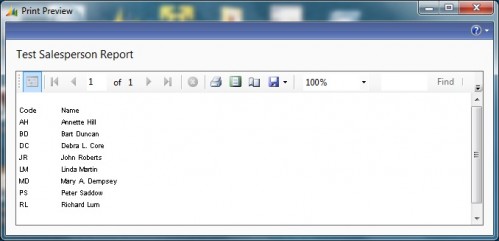
Now picture doing this for every review cycle (i.e. every time you want to preview a change you’ve made to an RDLC report), and you’ll understand why we refer to the process as “clunky”. It’s not as bad as it seems, mind you. After a while, your fingers get pretty quick at such repetitive tasks, but that, of course, can cause other problems…
Beware the Gotchas
There’s a reason we just dragged you through the preceding process loop, and it’s not because we’re sadists. Look again at the steps involved:
- Open report in classic report designer.
- View or create an RDLC layout and load it into the Visual Studio Report Designer.
- Perform layout work in Visual Studio. When you’re finished, save the Report.rdlc file.
- Switch back to the classic client, click on the data items form.
- NAV will ask you if you want to load the changes made to the RDLC layout. Say yes.
- Click File->Save to save and compile the report.
- Use the Windows run command to launch a preview of the updated RDLC version of the report (you can alternatively provide access to a report by putting it in a menu on a page in the RTC, but that won’t do much to shorten the process).
Now consider for a moment what will happen if you make changes during Step 3 of the process, save these changes in Visual Studio, then make some more changes, then switch back to the classic report designer without saving your second set of changes. NAV will still inform you that the RDLC layout was changed by Visual Studio. You will no doubt proceed to save and compile the report. But when you run a preview of the report, it will not render the report based on your latest version in Visual Studio. It will render it based on the version you last saved in Visual Studio, i.e. excluding any changes you made after that point (which may well be more your fault than NAV’s, but keep in mind the messages give you no clue; in fact, they go a long way to reassure you that all is well).
This may seem like a small issue, and indeed NAV will prompt you to close and save your layout in Visual Studio when you attempt to close the classic report, but if you’re new to the Visual Studio Report Designer and need to go through a lot of change/review loops during development, this type of gotcha can seriously mess up your debugging process.
So the moral of this post is: be careful in this environment, because it’s not only clunky – it’s a bit tricky, too.
Next Post
In the next post, we’ll undertake our first conversion of an existing NAV classic report into its RDLC counterpart, and begin showing you some of the problems you’ll encounter, as well as how to fix those problems.
Create Layout Suggestion
As described in see Converting Dynamics NAV Classic Reports To RDLC – Part 2, Dynamics NAV provides a Tools->Create Layout Suggestion menu option to automatically generate an RDLC layout for an existing NAV classic report.
Unfortunately, because classic and RDLC layouts are associated with two different reporting tools, they are not fully compatible. Some elements of a classic report will not properly translate to an RDLC layout.
The remainder of this article is devoted to these issues. It assumes you already have a firm grasp of both classic reports and Visual Studio’s Report Designer (if you’re weak on the latter, the online help of both NAV and Visual Studio are helpful, as is the book Microsoft Dynamics NAV 2009 Professional Reporting by Steve Renders – no affiliation).
Now, onto the issues, which we’ll tackle by making copies of some of Dynamics NAV’s standard reports, deleting their existing RDLC layouts (i.e. the ones created by Microsoft), then attempting to recreate those layouts.
Vertical Spacing
From the classic object designer, run Report 101, Customer List. Without selecting any of the filters, click the Preview button, which should result in something similar to the following:
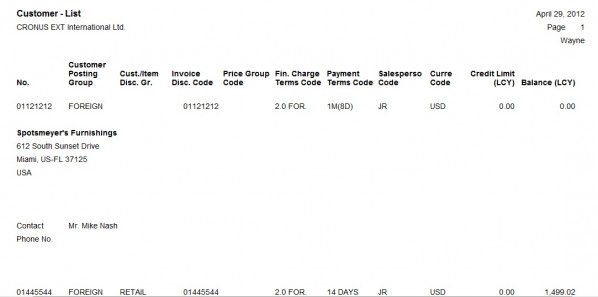
If you were to run the RDLC version of this report (i.e. from the RoleTailored Client), you would see that there are only minor differences between the two. That’s because Microsoft did the RDLC conversion for you.
To repeat the conversion process, return to the classic report designer and make a copy of the Customer List report under a different name and report number.
Then click the Tools->Create Layout Suggestion menu option for this copy. Because an RDLC layout already exists for the report, you will see the following message:
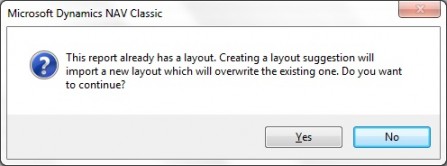
Click the “Yes” button, at which point the system will open Visual Studio Report Designer and show you your new layout. Complete the proper save and compile process and use the Windows Run command to run the RDLC version of the report (see Converting Dynamics NAV Classic Reports To RDLC – Part 2 for instructions), resulting in the following report:
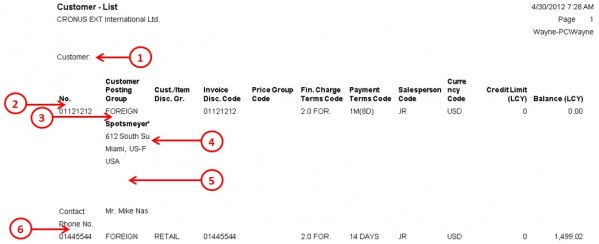
Comparing this report to the classic version and looking at issues 2, 3, and 6, it should be immediately apparent that the desired vertical space is missing between certain sections of the report. This is unfortunately a recurring problem when converting classic reports to RDLC, one you’ll have to fix manually by going into the Visual Studio Report Designer and adjusting the height and padding properties for each report item (or, in this case, because a table object is being used to display the data, each table row).
This is obviously a minor issue that is easy both to spot and fix. The danger lies in the situation represented by issue # 5. Here, it appears as if the vertical spacing has been preserved between the address and contact information. This is not the case, however. What’s happened is that 7 table rows (text boxes) have been reserved for address information, both in the classic and RDLC versions of the report, yet only 4 or 5 rows are typically used, making it appear as if the desired vertical spacing has been preserved. But should the report encounter a customer record that requires all seven address rows, the extra space will be entirely consumed.
The lesson here is that you can always expect vertical spacing issues in the RDLC layout generated by Create Layout Suggestion, so you need to manually check each situation and not assume it’s okay based on visual appearance alone.
Note, there is a more formal and conditional way of dealing with vertical spacing, which involves the use of a BlankLineCounter section in the classic version of the report, but we’ll address that in another post.
Horizontal Spacing
Another spacing issue is that of column width. See how the address information is chopped off on the right (issue # 4 in the image above)? If you examine the underlying RDLC layout, you will see that it appears as if Create Layout Suggestion allocated sufficient space to print the full width of the address (it didn’t, but let’s just pretend it did):
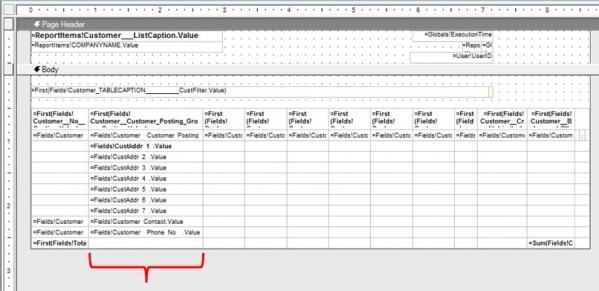
However, if you notice the ruler bar along the top, you will see that the report is already space-stressed horizontally for letter-size paper (especially when you add in margins). As a result, this expanded field is collapsed when you print the report, thereby chopping off the address information.
How do you fix this? In this case, because you are dealing with a table as a data region in the RDLC layout, you do what Microsoft did and merge some of the table cells, as follows:
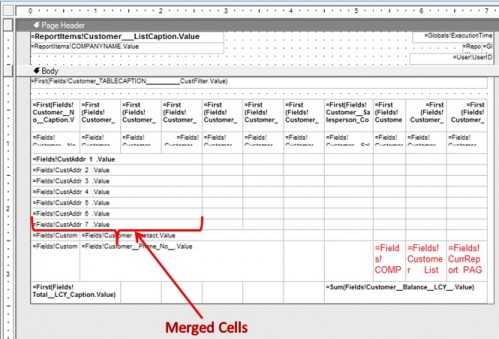
This is accomplished in the Visual Studio Report Designer by selecting the cells you wish to merge, right-clicking, and choosing the “Merge Cells” option. Note, also, that Microsoft increased the width of the address text boxes to 6.66 cm from 4.50 cm as part of this fix, and manually adjusted the size of other table columns to reduce the overall width of the report (see ruler at top).
The point of this section is that, as with vertical spacing, you can also expect to make significant manual adjustments to the horizontal spacing of any suggested RDLC layout. And, as with vertical spacing, you cannot rely on cursory visual observations alone to detect problems. What if, for example, the address fields had only been collapsed 10 % instead of 50 % in the above scenario? You may not have noticed the problem at first glance, but it could still cause an error when printing certain records.
Review, Review, Review
If you are a technical person, we’re sure you will find samples of vertical and horizontal spacing issues somewhat trivial, and certainly they are trivial to fix. The real issue here is about process. When you generate an RDLC layout using Create Layout Suggestion, you are strongly advised to check all vertical and horizontal spacing issues to the same degree you would when building a report from scratch.
You should also use the Print Layout Mode when previewing a report in the Visual Studio Report Viewer, as Print Preview won’t reveal all the layout issues.
Finally, we hope you have seen the value of making a copy of a standard NAV report, generating a new RDLC layout via Create Layout Suggestion, then comparing this layout to the one provided by Microsoft. Not only will this teach you about the shortcomings in the generated layout; it will also teach you how to address them.
Next Post
In the next post, we’ll go deeper on this Customer List report and examine the issues of conditional output and using data fields in page headers & footers in RDLC reports.
Preceding Posts
In Part 1 of this series of posts, we examined the underlying technologies behind RDLC reporting. In Part 2, we looked at the basic process of converting Dynamics NAV classic reports to an RDLC layout. In Part 3, we began examining some of the issues you will encounter when you use NAV’s Create Layout Suggestion function to generate an RDLC layout, starting with vertical and horizontal spacing.
We’ll now continue that approach by examining other common issues you will face in the conversion process, again starting with Report 101 – Customer List (see Converting Dynamics NAV Classic Reports To RDLC – Part 3 for our previous work with this report).
Using Dataset Fields in Page Headers and Page Footers
If you run the original classic Customer List report, it will produce the following report header:

If you examine the header in the classic report designer, you will see it consists of labels and TextBoxes displaying either straight text or the results of various functions (such as the Database function COMPANYNAME and the CurrReport function PAGENO).
In every case, NAV’s Create Layout Suggestion will convert these values into RDLC dataset fields. The problem is, RDLC reports cannot use dataset fields in their page header or page footer. So the Create Layout Suggestion does the following instead:
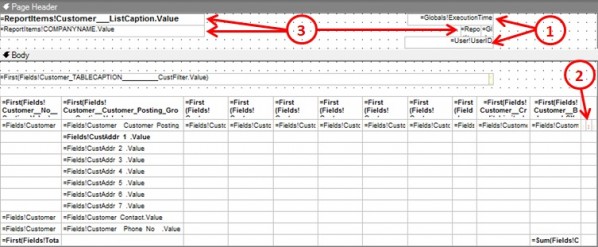
- It will use global functions where it can in the page header/footer, as in the case of date/time and the user ID.
- Where it cannot use global functions, i.e. where the source data can only be found in dataset fields, it will insert Textboxes for these fields in the body of the report, set the visibility for these Textboxes to “Hidden”, and set their font to red to indicate they were created by the Create Layout Suggestion process.
- It will then insert additional Textboxes in the page header/footer, and set the value of this second group of Textboxes to equal the values of the corresponding hidden Textboxes.
In other words, since the Textboxes in the page header/footer can’t directly connect to dataset fields, they connect instead to the hidden Textboxes in the report body, which, like proxies, essentially connect to the dataset fields on their behalf.
There is nothing for you, the programmer, to do in this arrangement. It is all done automatically by the Create Layout Suggestion process, except for one task, which is best illustrated by examining Microsoft’s manual post-conversion changes of the same Customer List report:
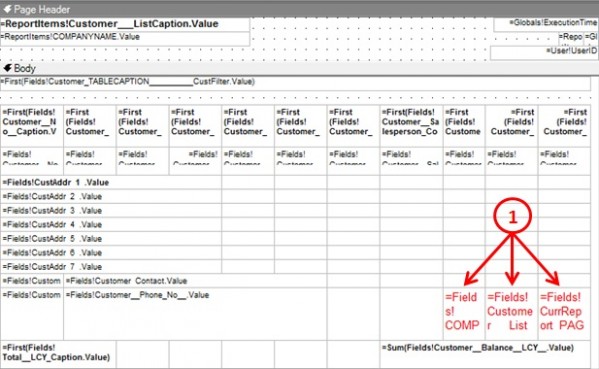
As item 1 shows, Microsoft moved the hidden Textboxes from the right-hand side of the table to unused cells within the main body of the table. This was done because hidden Textboxes outside the width of standard paper may cause layout problems. In this case, it also has the added benefit of making the hidden Textboxes more visible to other programmers.
Of course, there may be times when you need to place your own hidden fields somewhere in the report, typically to support their use inside a page header/footer, but having nothing to do with Create Layout Suggestion. In this case, you are advised to use a yellow font to distinguish such fields from those created automatically by Create Layout Suggestion.
Hiding the Filter Line When No Filter is Specified
If you run the copy version of the Customer List Report (the one we had you create in Converting Dynamics NAV Classic Reports To RDLC – Part 3), you will notice that it displays a filter line in the report even when no filter is specified:
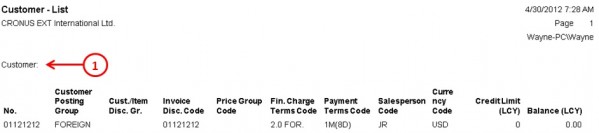
This does not display in the original classic version of the report because of the following code in the OnPreSection() trigger of the header section containing the filter line:
CurrReport.SHOWOUTPUT((CurrReport.PAGENO = 1) AND (CustFilter <> ”));
However, if you recall from Converting Dynamics NAV Classic Reports To RDLC – Part 1, RDLC reports don’t run the section code from their classic counterparts (i.e. only the data items portion of the classic report is run), so this trigger code is never fired. Instead, you must insert a hidden control in the classic report that you can use as a variable in the RDLC report.
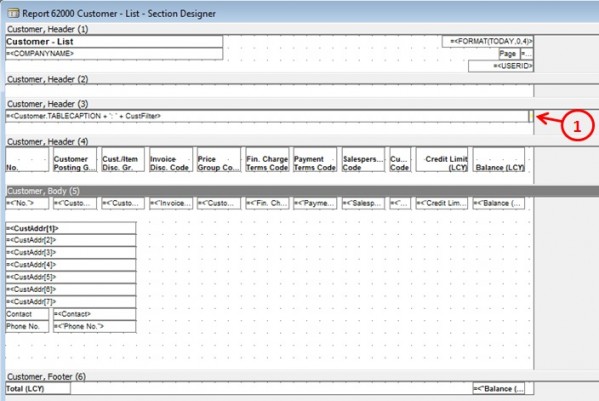
As you can see from item 1 above, Microsoft has already inserted the hidden control for you, namely a TextBox that uses the CustFilter variable as its source expression. This will then become a field in the dataset passed to the RDLC report, and also a Textbox in the body of this report:
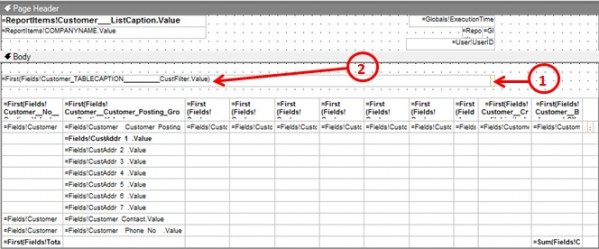
The small Textbox identified as item #1 is the one that references the CustFilter dataset field. You can delete this Textbox, as it’s not required. The larger Textbox identified as # 2 is the one that actually displays the filter data. Right click this Textbox and select “Properties”, which will bring up this panel:
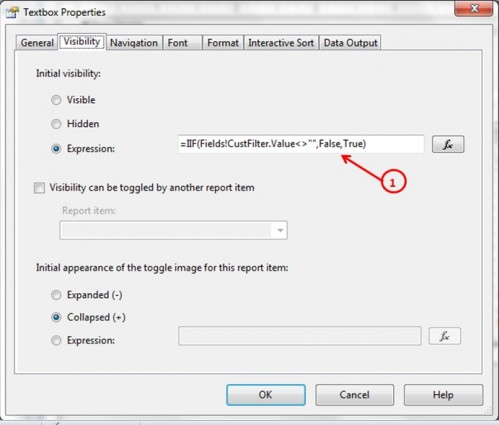
Select the Visibility tab, then set the Initial Visibility section to “Expressions”, using the following formula, as shown by # 1 above:
=IIF(Fields!CustFilter.Value<>””,False,True)
Click OK and the RDLC report will now display a filter line only when a filter has been set.
Summary of Steps Required to Convert The Customer List to RDLC
Assuming Microsoft had done nothing to prepare for the conversion of Report 101 – Customer List, here are the steps you would have had to perform to do the conversion yourself:
- Insert a hidden TextBox with the CustFilter variable as its SourceExpr into the classic version of the report.
- Run Create Layout Suggestion to produce an initial RDLC layout, which will include your hidden CustFilter both as a field in the dataset and as a Textbox in the body of the RDLC report.
- Delete the CustFilter Textbox from the RDLC report.
- Use the CustFilter field value in the RDLC dataset to control the visibility of the RDLC report’s filter line, which is actually a Textbox with a name of “Customer_TABLECAPTION__________CustFilter”.
- Adjust RDLC vertical spacing using the Height and Padding properties or report objects.
- Adjust RDLC horizontal spacing. In particular, merge the customer address table cells with cells to their right to give them sufficient space for printing, while shrinking the width of other table columns to ensure the overall report width will fit inside your target paper size.
- Move any hidden Textboxes inserted into the RDLC layout by the Create Layout Suggestion process into an unused space in the body of the report (in this case, into unused table cells). This will not only help you ensure the overall width of the report will fit inside your target paper size, but, if the table cells are larger, will also make the hidden cells more visible to other programmers.
Next Post
In the next post, we’ll convert a more complicated NAV standard report to demonstrate other issues you will encounter in the report conversion process.
Preceding Post
In Converting Dynamics NAV Classic Reports To RDLC – Part 5 of this series, we began to convert the classic Report 5703 – Transfer Order to its RDLC equivalent. We’ll now continue that process.
Understanding Report 5703 – Transfer Order
The key to understanding Report 5703 – Transfer Order is understanding the basic processing loop set up by its data items, which happens to be the same basic processing loop for all Dynamics NAV document reports:
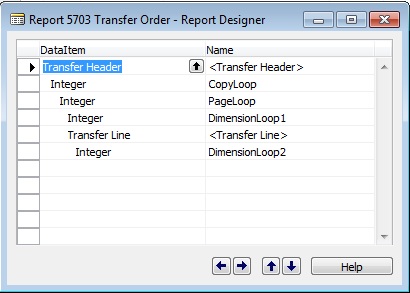
The top-level set of records in this processing loop is determined by the Transfer Header data item, as you might expect. If the filter criteria you set in the Request Page limits the result set to 4 transfer orders, the Transfer Header data item will contain header records for those 4 orders.
The next three data items all involve copies of the Integer table, which is a one-field virtual table (Field Name = “Number”) that is computed on the fly to contain one row per integer in the range of integers you specify. So, if you specified a filter against the Integer table where Number >= 1 and Number <= 6 , your Integer data item would contain 6 records with values in the Number field ranging from 1 to 6.
The first instance of the Integer table in this report is the data item called “CopyLoop”. Its contents are set in its OnPreDataItem() trigger, as follows:
NoOfLoops := ABS(NoOfCopies) + 1;SETRANGE(Number,1,NoOfLoops);
“NoOfCopies” is an integer variable that stores the number of copies you have requested through the report’s Request Page. NoOfLoops is an integer variable set to equal NoOfCopies plus 1 (to account for the first output of a transfer order, which is not considered a copy). Finally, the CopyLoop data item is computed to contain one row for each of the integers between 1 and NoOfLoops inclusive.
So, if you requested 2 copies of a report:
- NoOfCopies would equal 2;
- NoOfLoops would equal 3 (NoOfCopies + 1);
- The CopyLoop instance of the Integer virtual table would be constructed on the fly to contain three records, one each for the integers 1, 2, and 3;
The second instance of the Integer table is the data item PageLoop. If you’re looking for the C/AL code that filters it, you won’t find it. It’s filtered in its DataItemTableView property: SORTING(Number) WHERE(Number=CONST(1)). This means there is one PageLoop data item for every CopyLoop data item.
There is no code associated with the PageLoop data item. As you’ll see, its purpose is to provide a report section that will act as the de facto header for each transfer order being printed.
The third instance of the Integer table is the data item DimensionLoop1. Ignore this for now, as it is only utilized when the “Show Internal Information” CheckBox is checked.
The next data item is Transfer Line. It is indented to the PageLoop data item, which means it will be processed at least once for each PageLoop record, but its data is actually restricted by a relationship with the Transfer Header data item, meaning it will contain all the detail lines for the transfer order, as you would expect.
Finally, there is another Integer data item, called DimensionLoop2, which is again related to the “Show Internal Information” Checkbox, so, again, we’ll ignore it for now.
Putting this all together, we end up with the following processing loop when we have requested one copy:
Transfer Header Record # 1CopyLoop Record # 1, representing the original output of the report for the first transfer orderPageLoop Record # 1Transfer Line Record # 1 (i.e. for Header Record # 1)Transfer Line Record # 2…CopyLoop Record # 2, representing the first copy of the report for the first transfer orderPageLoop Record # 1Transfer Line Record # 1Transfer Line Record # 2
…and so on for all the other transfer orders in the report.
That’s the processing loop. As for the resulting data, keep in mind that it is a flattened dataset that essentially contains the following (if you don’t understand why, see Converting Dynamics NAV Classic Reports To RDLC – Part 1):
Transfer Header Record # 1 fields + Transfer Line Record # 1 fields (i.e. for that header record)Transfer Header Record # 1 fields + Transfer Line Record # 2 fieldsTransfer Header Record # 1 Copy fields + Transfer Line Record # 1 Copy fieldsTransfer Header Record # 1 Copy fields + Transfer Line Record # 2 Copy fields
…and so on through the report’s other transfer order records (in actual fact, there’s slightly more in the result set than this, but we’ll leave that until Part 8 of this series).
Our problem is that we need a field we can group on in the RDLC version of the report, one that allows us to distinguish between each transfer order and each copy of that order (see Converting Dynamics NAV Classic Reports To RDLC – Part 5 to understand why), and such a field is not present in either our current dataset or in our database tables. We therefore have to create it.
Modifying the Dataset Coming From the Classic Report
We start by defining a new global integer variable called “OutputNo” (it is probably already in your test copy of Report 5703). Remember the “IF ISSERVICETIER…” code that we commented out in the CopyLoop data item triggers as part of the previous post? Re-activate that code now so that your CopyLoop data triggers look like this:
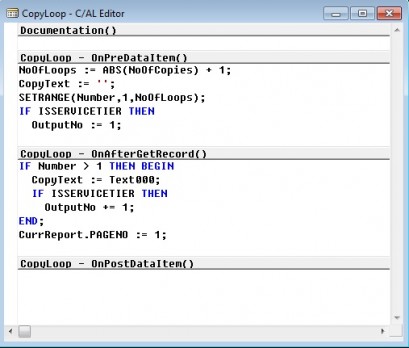
“IF ISSERVICETIER” is the C/AL way of checking if the RDLC version of the report is being run.
As the code shows, its net effect is to set OutputNo so that it equals 1 for the original output of a transfer order, 2 for the first copy of that order, 3 for the second copy, and so on.
Of course, OutputNo won’t make it into the RDLC dataset just because we set its value. We have to link it to a TextBox placed in a section of the classic report (a requirement in order for any value to make it into the RDLC dataset). However, we don’t want this TextBox to be visible because that would cause a problem for the classic version of the report, so we set its Visible property to false. By convention, when we set a TextBox’s Visible property to false in a report, we must also set its ForeColor property to 65535, i.e. Yellow. Here are the exact properties to set:
Name = OutputNoVisible = NoForeColor = 65535SourceExpr = OutputNo
You then place this TextBox in a logical place (i.e. in this case, the report’s header because the value is associated with the header), shrink its dimensions to 150 x 423 (i.e. as narrow as possible, standard field height), and you will end up with a classic layout like this:
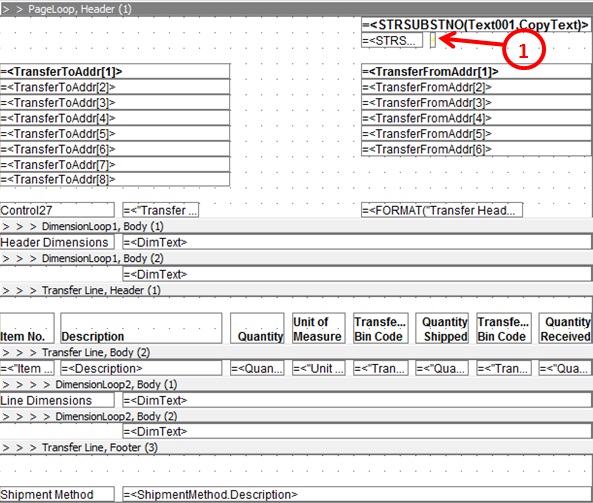
Congratulations. You’ve just restored one of the hidden TextBoxes we had you delete at the start of the previous post, and in doing so you have repeated one of the steps Microsoft performed to create its RDLC version of Report 5703 – Transfer Order. This will ensure OutputNo makes it into our RDLC dataset. Now we have to make use of it.
Grouping the List Data Region in the RDLC Report
View the RDLC layout for your report again. Select the properties window for the List data region you created in the previous post:
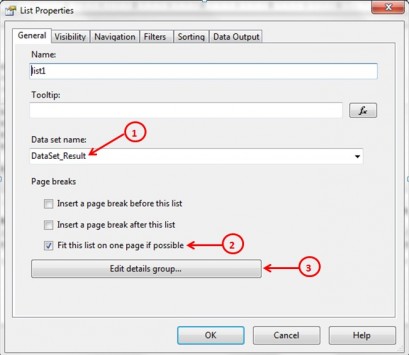
Click the “Genera”l tab, as shown. Then perform the following steps:
- Select your dataset here.
- Check the “Fit this list on one page if possible” Checkbox.
- Click the “Edit details group…” button.
This will open the Grouping and Sorting Properties page, as follows:
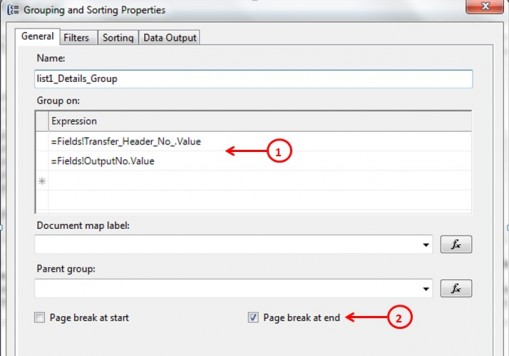
Click the “General” tab, as shown. Then perform the following steps:
- Enter the “Group On Expression” fields as shown.
- Check the “Page break at end” Checkbox.
Now switch to the “Sorting” tab and set the same two fields, in the same order, for the sorting expression, too.
Click the “Okay” button, returning you to the List Properties page. Now switch to its “Sorting” tab and set the same two fields in the same order.
Testing The New Version of Your Report
Now save and compile your work, and run the new version of your RDLC report. If you have followed all the preceding steps correctly, you should see something quite similar to the following:
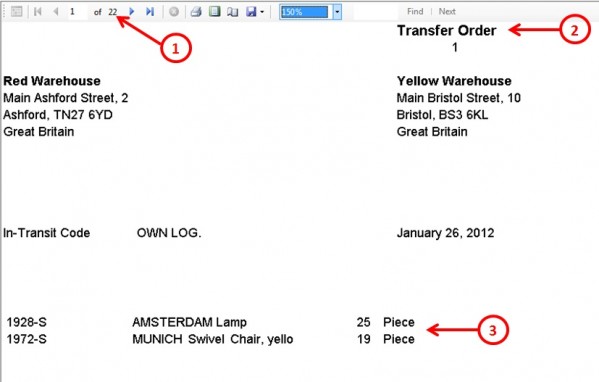
Observe the following:
- There are now multiple pages to the report. In fact, in this case, because each transfer order fits on one page, the Number of Pages = Number of Transfer Orders + (Number of Transfer Orders x Number of Requested Copies).
- If you navigate through the record set, you will see that each printed order is properly identified as either an original (no “Copy” beside “Transfer Order”), or a copy. Note, we have done nothing to set this labeling. It is a carryover from the classic report that now works because we’ve implemented the OutputNo variable.
- The detail lines are now restricted to the lines associated with the current transfer order and only that order.
In other words we have fixed the multiple copy issue.
As you can see, however, there are still plenty of other issues to address.
Next Post
In our next post, we’ll continue our repairs to the RDLC version of Report 5703 – Transfer Order post conversion.