
Preceding Posts In This Series
In Part 1 of this series of posts, we examined the underlying technologies behind RDLC reporting. In Part 2, we looked at the basic process of converting Dynamics NAV classic reports to an RDLC layout.
In parts 3 & 4, we examined some of the issues you will encounter when you use NAV’s Create Layout Suggestion function to generate an RDLC layout, including horizontal and vertical spacing, the use of dataset fields in RDLC report headers and footers, and controlling conditional output.
We’ll now continue that approach by performing the conversion of a more complex report, the document report 5703 – Transfer Order. This example is important because document reports tend to pose the biggest challenge in converting reports to an RDLC layout.
Reversing Microsoft’s Preparations for the Conversion
First, make a copy of 5703 – Transfer Order. Call it “Transfer Order Test”.
Next, open the test copy in the classic report designer. View the report’s sections and delete any TextBoxes with a yellow font. These include “PageCaption” and “OutputNo” in the PageLoop header, “DimensionLoop1.number” in the DimensionLoop1 body, “NoOfCopies” and “ShowInternalInfo” in the TransferLine header, the unnamed TextBox with a SourceExpr of “Transfer Line”.”Line No.” in the Transfer Line Body, and “DimensionLoop2.number” in the DimensionLoop2 body.
Finally, view the C/AL code associated with the CopyLoop data item and comment out any code blocks that begin with ‘IF ISSERVICETIER”.
We’ll be recreating all these TextBoxes and reactivating these code blocks later, but they were not part of the original report, i.e. they were created by Microsoft only to support the conversion to RDLC, and we want you to re-discover the need for them.
Test Your Starting Point
To ensure we haven’t messed up anything, run the classic version of both your test report and the original report and compare them. Make sure you request one additional copy of the report on the Options tab, but do NOT check the “Show Internal Information” CheckBox. Navigate to the first transfer order copy, which should look like this:
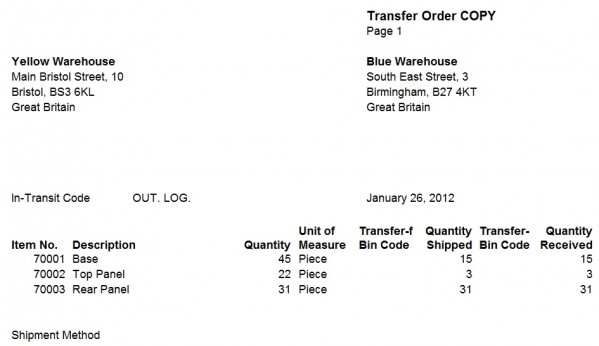
As expected, the report is showing the contents of one transfer order per page, followed by a copy of that transfer order, and so on through the record set. Creating multiple copies (and marking them as such) is one of the features we’ll have to implement in RDLC post-conversion.
Create Layout Suggestion Results
Now run the Tools->Create Layout Suggestion function from your test report to produce your initial RDLC layout (in this case, because your test report still contains a copy of the RDLC layout from the original report, you will have to agree to overwrite that layout). Save and compile the report, then run the new RDLC version from the Windows run command (if you don’t know how to do this, see Converting Dynamics NAV Classic Reports To RDLC – Part 2). Again, on the Options tab of the Request Page, make sure you request one copy but leave the “Show Internal Information” CheckBox unchecked.
The initial RDLC report should appear as follows:
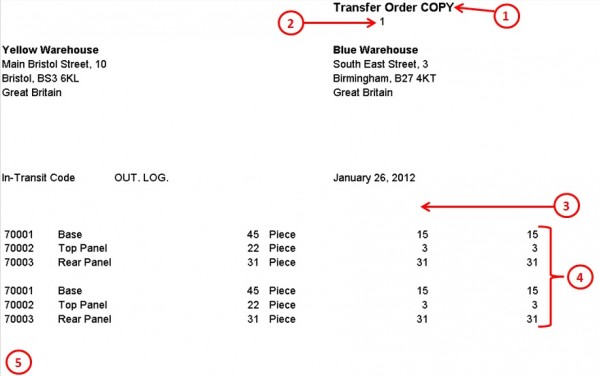
Right away, we can see that:
- The top right line indicates you are looking at a copy, but in fact you are looking at the first page of your report, i.e. you haven’t navigated to a copy yet. Furthermore, you will discover that there are no more pages to the report. You only have one page, and it is marked as a copy.
- The word “Page” is missing from the next line down.
- There are no column headings.
- Two sets of identical data have been output. In fact, if you scroll down the report, you will see there are two sets of data being output for every transfer order that meets the report’s filter criteria. Why two sets? In this case, we have asked for 1 copy (i.e. the original report plus one copy of it), so the report seems to be printing all the original and copy information on the same page.
- The “Shipment Method” heading is missing from the bottom left of the report.
If you switch to Print Layout, things get even more perplexing. You suddenly end up with two pages instead of one, and, stranger still, you end up with different from/to warehouses on each page.
Now let’s have a quick look at the RDLC layout, as follows:
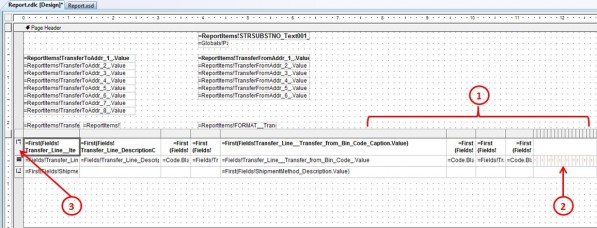
At first glance, the layout appears to contain the basic header/details structure we’re after. But if you look closer, you start to spot a few basic problems:
- The report’s far too wide at 12.5 inches.
- A large number of invisible Textboxes have been inserted by the Create Layout Suggestion process (identified by their red font color).
- All the data is being presented in a table.
If you are familiar with RDLC reporting controls, it is Point 3 that should immediately draw your attention. The Table data region is designed to expand vertically down a page to accommodate a variable number of records; it is not designed to print one record or one set of records per page.
The RDLC reporting control you want for that job is the List data region. So let’s start by doing the following:
- Drag a List data region onto the RDLC reporting surface.
- Cut and paste the table inside the List data region.
- Reposition your combo List-Table data region to its rightful place.
Simply placing your details table inside a List data region won’t do the trick, however. If you read the Visual Studio help on List data regions, you will see their description is “A list data region repeats with each group or row in the report dataset”.
If you refer back to the way the data set is constructed for RDLC reports, you will quickly realize that repeating with each row won’t work in this case, as the dataset will contain one flattened row for every transfer order detail record in the report (see if you don’t understand why). What you need to do is group the list on some field. But which field?
Common sense suggests you’d group on the transfer “No.” field, but that won’t work because you have to contend with copies, remember? There could be more than one set of records in the dataset per transfer order.
A quick perusal of the RDLC dataset shows there is in fact no field that can help you distinguish between copies. That means you’ll have create one in the data items of the classic report. However, to figure out how to do that, you’ll first have to understand how the classic report works.
Next Post
In our next post, we’ll continue our repairs to the RDLC version of Report 5703 – Transfer Order post conversion.
Microsoft has just released the Dynamics NAV 2013 beta version for partners. If you’re a NAV partner, you can access the official launch portal on PartnerSource. If you’re not a partner, you can still get a lot of information about NAV 2013 from this site: Dynamics NAV 2013 Beta page on MSDN.
For more information, you can also access the links on this page Dynamics NAV Official Microsoft Sites and this one Other NAV Community Sites and Forums.
Preceding Posts In This Series
In Part 1 of this series of posts, we examined the underlying technologies behind RDLC reporting. In Part 2, we looked at the basic process of converting Dynamics NAV classic reports to an RDLC layout.
Since then, we’ve been examining specific issues you will encounter during the conversion process. In Converting Dynamics NAV Classic Reports To RDLC – Part 5 and Converting Dynamics NAV Classic Reports To RDLC – Part 6, we turned our attention to Report 5703 – Transfer Order as a sample conversion of a document report. We’ll now continue describing that conversion.
The Missing “Page” Label in the Upper Right Corner of the Header
At first glance, this appears to be a simple issue. However, there is more to it than meets the eye.
In the classic report, the line in the top right corner (i.e. the one that starts with “Transfer Order”) is a TextBox with a SourceExpr of “STRSUBSTNO(Text001,CopyText)”, where Text001 is a text constant set to “Transfer Order %1” and CopyText is a global variable set in the C/AL code of the CopyLoop data item to equal either “COPY” or blank.
Therefore, STRSUBSTNO(Text001,CopyText) = STRSUBSTR(‘Transfer Order %1’, ‘COPY’) = “Transfer Order COPY” in the case of a copy, and STRSUBSTR(‘Transfer Order %1’, ”) = “Transfer Order” where no copy is involved.
During the RDLC conversion process, the presence of this TextBox first results in a creation of a field in the RDLC data set. However, because this field must be used in the page header, where direct access to data fields is not allowed, the conversion process first creates an invisible Textbox to reference the field in the body of the RDLC report (the first small Textbox with the red font set in the far right portion of the body), then creates a second Textbox in the header to reference the hidden Textbox by way of the VB expression: “=ReportItems!STRSUBSTNO_Text001_CopyText_.Value”.
This is shown in the following image of the RDLC layout:
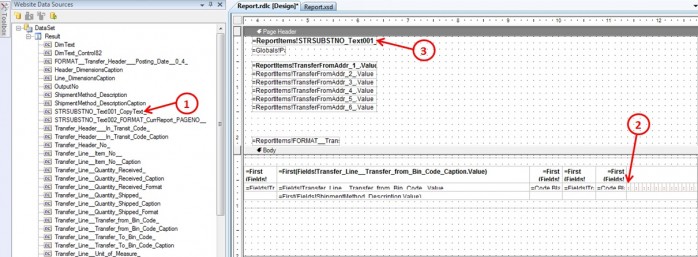
- TextBox in the classic report results in creation of an RDLC dataset field.
- RDLC conversion process detects that the field must be used in a header, so it creates an invisible Textbox here in the body.
- RDLC conversion process creates visible Textbox in the header, which uses an expression to reference the value of the hidden Textbox.
This is all standard behavior, but now let’s examine the TextBox that’s supposed to display the word “Page” followed by the page number.
It starts out quite similar to the “Transfer Order…” TextBox by using the SourceExpr “STRSUBSTNO(Text002,FORMAT(CurrReport.PAGENO))”, where Text002 is a text constant set to “Page %1”, and CurrReport.PAGENO is a function that allows you to set or retrieve the current page number.
This, in turn, does result in the creation of a field in the RDLC data set, called “STRSUBSTNO_Text002_FORMAT_CurrReport_PAGENO__”. But instead of treating this like the text value that is intended, the RDLC conversion process detects the attempt in the classic TextBox to use the CurrReport.PAGENO function, which is not supported in RDLC, and instead substitutes its own global page number function, “=Globals!PageNumber”, as shown below:
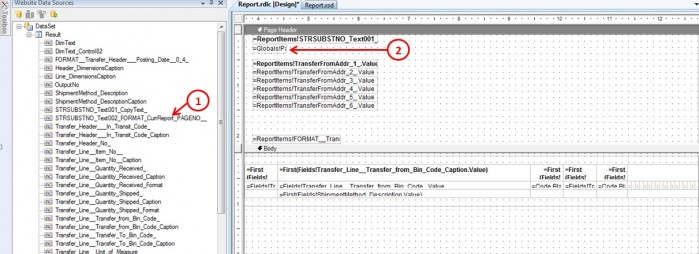
- Dataset field is created, but it is not placed anywhere on the report.
- Because of the presence of the CurrReport.PageNo function in the source TextBox, the conversion process creates a Textbox using the RDLC PageNumber function instead.
This not only results in the “Page” label being dropped. It also results in the display of the incorrect page number, which is supposed to reset to 1 for each new transfer order or copy thereof.
RDLC Conversion Behavior
Why spend so much time describing the page numbering mechanism in this report? First, because it explains the otherwise inexplicable difference in the conversion treatment of two classic TextBoxes that appear, on the surface, to be quite similar.
Second, to drive home a central point: the RDLC conversion process is not very sophisticated. To be safe, you should therefore expect the unexpected in the conversion of every single reporting object.
How do you fix the problem described in this post? The simple/crude answer is, you do what the RDLC conversion process should have done, i.e. use the standard approach, which is to create an invisible Textbox in the body of the RDLC report referencing the dataset field, then create a second Textbox in the page header to reference the value of the invisible Textbox.
However, there is a much more sophisticated solution to this problem (and others), which I’ll address later in this series of posts, but, for now, apply the simple solution to restore the proper page numbering.
Next Post
In our next post, we’ll continue with our repairs to the RDLC version of Report 5703 – Transfer Order, working our way from the top of the report to the bottom.
Preceding Posts In This Series
In Part 1 of this series of posts, we examined the underlying technologies behind RDLC reporting. In Part 2, we looked at the basic process of converting Dynamics NAV classic reports to an RDLC layout.
Since then, we’ve been working through the specific issues you will encounter during the conversion process.
In parts 5 to 7, we began converting Report 5703 – Transfer Order, which is a document report – the type of report that will likely pose your biggest challenge in transitioning to RDLC layouts. As part of that conversion, we analyzed the classic version of the report in some detail, fixed a problem with the multiple copies feature in the RDLC version, and resolved a labeling problem in the RDLC version created by NAV’s Create Layout Suggestion, where the program had improperly substituted one of its global functions for a perfectly valid text data field.
So what remains to be done?
Assessing the Remaining Problems With Report 5703 – Transfer Order
As a refresher, here’s an image of how the classic version of the report should look:
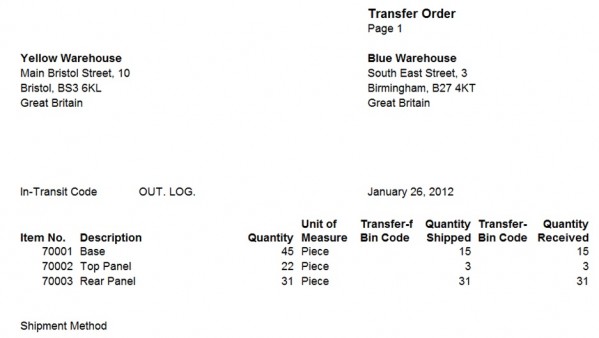
If you’re using the Cronus Ext database, the transfer order shown here is for the second transfer order in the database, i.e. Transfer Order No. 1002. Here’s the same transfer order presented in our latest version of the RDLC report:
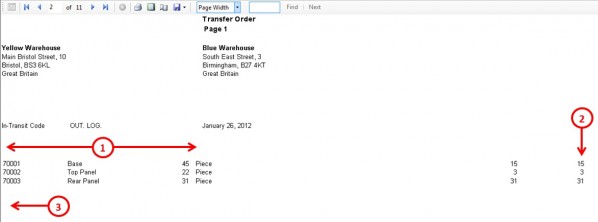
The remaining problems are:
- Column headings are missing in the body.
- The report is much too wide. If you want to see the true effect of this, switch to the Print Layout in preview mode.
- The Shipment Method label is missing.
Fixing the Missing Column Headings
Why are the column headings missing? Well, first, let’s keep in mind that we are dealing with a flattened dataset (if you don’t understand why, see Converting Dynamics NAV Classic Reports To RDLC – Part 1). The data for your column headings is therefore a set of fields within the same record structure as the rest of your data, i.e. the dataset passed to your RDLC report by the classic reporting engine. Whenever data is missing from a report, the first thing you should do is check whether the data has made it into the underlying dataset.
How do you check this? Perform the following procedure:
- Run your RDLC report. Make sure you request 0 copies.
- Under the Help menu in the upper right-hand corner of the report previewer, you should see an option labelled “About This Report”.
- The first time you click this option, it will tell you that the feature you desire has been set up and that you need to run the report again (though not using that exact wording). Do as the message says and close the report, then run it again.
- The second time you run the RDLC report, click the About This Report option again. This time, NAV will present you with a tabular listing of the dataset.
Now examine the listing, in particular the rows for the Transfer Order No. 1002, which we’ve highlighted in blue:
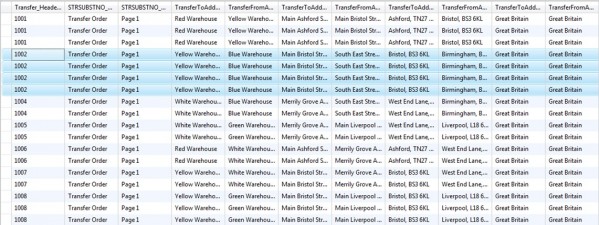
Compared to the report output, the first thing you should notice is that there are four data records for Transfer Order No. 1002, yet only three detail lines in the report itself.
Why is that?
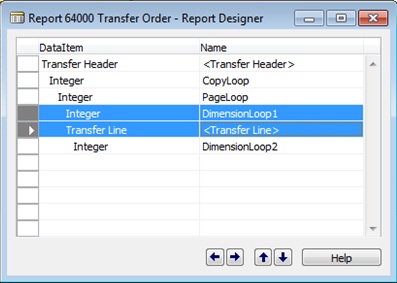
The short answer is because, in the classic report designer, the third Integer data item and the Transfer Line data item both have a DataItemLinkReference to the Transfer Header data item, and both share the same level of indentation. Thus, in a flattened dataset model, the header data item is joined first to the Integer data item, which contains only 1 record (thus producing 1 result record), then to the Transfer Line data item, which contains 3 detail records for this transfer order (thus producing 3 result records). The final dataset for our sample transfer order therefore has 4 records (for a complete description of the dataset’s creation, see Converting Dynamics NAV Classic Reports To RDLC – Part 6).
But, given that Integer data items are virtual tables with only 1 field (Number), what’s in all the other flattened dataset fields for that record, including the ones containing the column heading values?
If you said “nothing”, you win the prize. We can confirm our “nothing” hypothesis by scrolling right in our “About This Report” dataset listing until the leftmost column is none other than “Transfer_Line_Item_No_Caption” – our first column heading field:
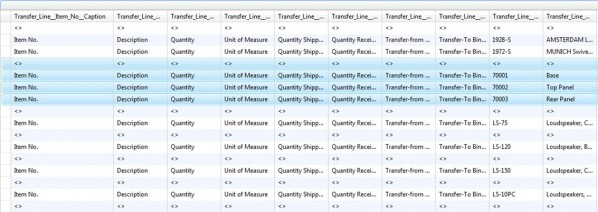
As you can see, the column heading fields for the first record of any transfer order are all blank. This gives us our first likely suspect in why the column headings themselves are blank, but we cannot yet declare the crime solved. Before we can do that, we have to examine the RDLC layout, in particular the placement of the column headings.
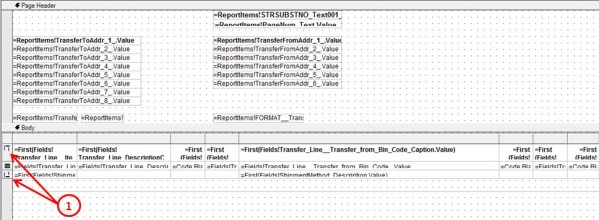
When you do this, you will find that the column headings are in the top row of the table in the Body section, while the Shipment Method label (and data field) are in the bottom row. But these are not regular table header/footer rows, as you might expect. They are group header/footer rows.
Hmmm, the plot thickens. What is our table grouped on? If you right click the group header symbol and select “Edit Group”, it will open up the following window:
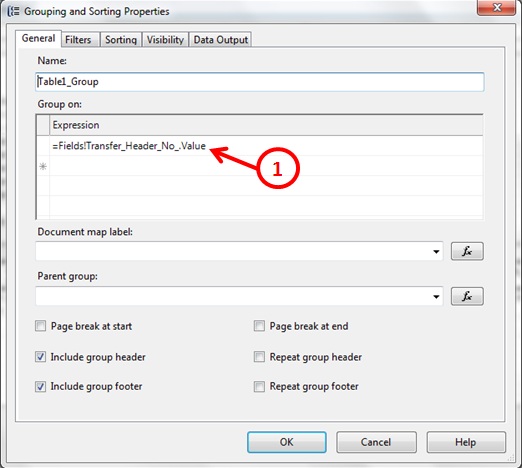
As you can see, the table is grouped on the Transfer_Header_No. field. This is an utterly useless grouping. It was useless at the moment of conversion because, in a report with potentially multiple copies of each transfer order, there could be multiple sets of data sharing the same Transfer Header No.
It became even more useless when we placed the table inside a List data region in Converting Dynamics NAV Classic Reports To RDLC – Part 6, which we then grouped on a combination of Transfer_Header_No. and OutputNo (essentially the copy number). The table grouping is therefore redundant.
However, that’s not the point of this post. The point is that table group header values are drawn from the first record in the group, which, as we’ve already seen, contain blank column heading values, and the grouping/sorting at the list and table levels have done nothing to change that fact.
Now that we understand the problem, how do we fix it?
There are actually numerous ways to fix it, some better than others given the functionality we still have to implement for this report. But, for now, let’s take the easy road and simply filter out the blank record at the table level. To do this, open the table properties and set the following filter in the Filters tab:
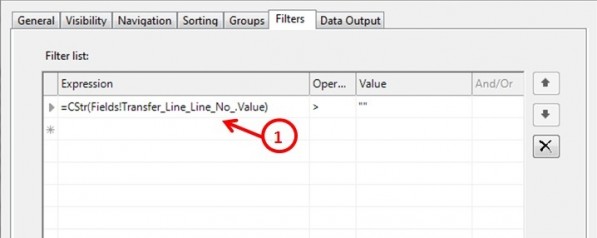
Now save, compile, and run the report, and you will see that your column headings and your Shipment Method label will both now appear.
Fixing the Spacing Issues
From a visual perspective, all that remains to be done with this report now (so long as we continue to run the simple version of it) is to fix the spacing issues. For instructions on how to do this, see Converting Dynamics NAV Classic Reports To RDLC – Part 3.
Next Post
In our next post, we’ll continue the repairs to Report 5703 – Transfer Order by implementing the Show Internal Information option, which will display the dimension values associated with each transfer line.
Preceding Posts In This Series
In Part 1 of this series of posts, we examined the underlying technologies behind RDLC reporting. In Part 2, we looked at the basic process of converting Dynamics NAV classic reports to an RDLC layout.
Since then, we’ve been working through the specific issues you will encounter during the conversion process.
Since part 5, we’ve been walking through the conversion of Report 5703 – Transfer Order as an example of the issues you’ll face in converting a document report – the type of report that will likely pose your biggest challenge in transitioning to RDLC layouts. In these next two posts, we’ll complete the conversion of this report.
The Current State of Your RDLC Version of Report 5703 – Transfer Order
If you have been faithfully following this series of posts, your current RDLC version of Report 5703 – Transfer Order should look something like this:
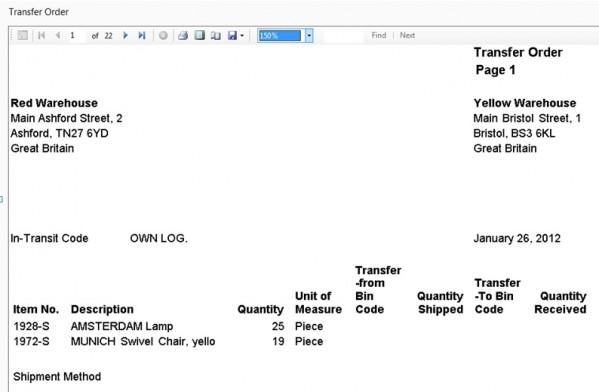
This assumes you have addressed the spacing and layout issues you were urged to fix at the end of the previous post.
So, with the report appearance corrected, and the multiple copies function working correctly, what remains? If you choose this report option…
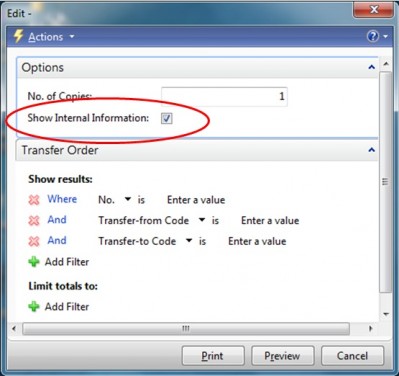
…and click Preview, you will quickly see that this option does…absolutely nothing, which constitutes the last functional deficiency in your report, because what it’s suppose to do (and what it does in the classic version of the report) is:
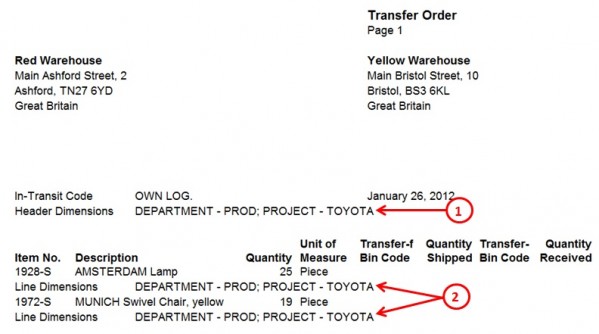
…it adds dimension information, both in the lower section of the report header (Header Dimensions) and in between each of the order lines (Line Dimensions).
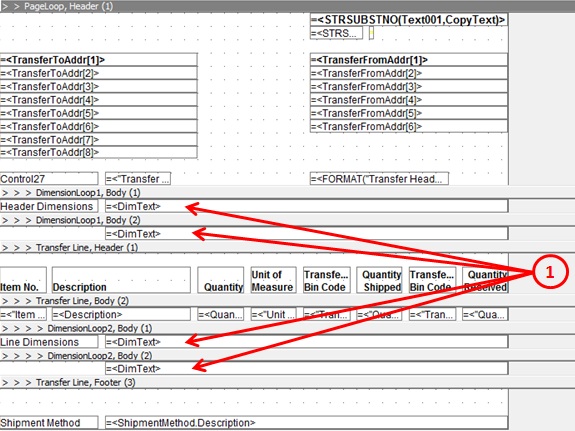
So, why doesn’t the Show Internal Information option have the desired effect in the RDLC version of the report? The simple answer is because the sections (and fields) for the dimension lines, shown here in the classic report…
…didn’t migrate to the RDLC report layout:
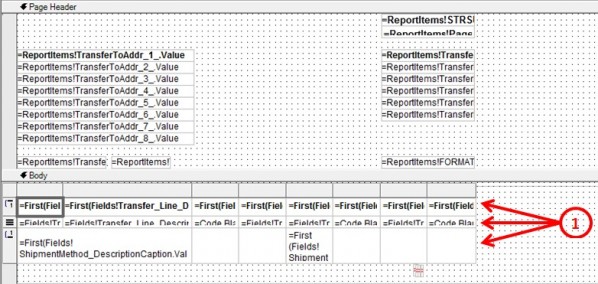
As you can see, the body of the report has only three rows – a group header, a detail row, and a group footer, all related to Transfer Line data, with nary a dimension row in sight.
Why didn’t the dimension rows/fields make it into the RDLC version of the report? That’s the million dollar question, and to be able to answer it, we need to start by understanding how the classic report builds its dimension rows in the first place.
The Classic Report’s Handling of Dimensions at the Data Item Level
If you recall from earlier posts in this series, the classic data structure for the Report 5703 – Transfer Order looks like this:
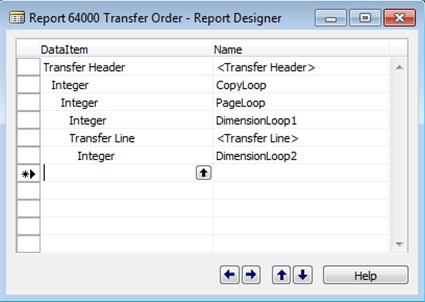
The main processing loop is explained in Converting Dynamics NAV Classic Reports To RDLC – Part 6. In this post, our interest is in the DimensionLoop1 and DimensionLoop2 data items, both of which are instances of the virtual Integer table, with DimensionLoop1 referencing the Transfer Header data item, and DimensionLoop2 referencing the Transfer Line table.
Whenever we see the Integer table being used as a data item, it’s usually a good idea to determine how many integer numbers are being used. In this case, DimensionLoop1’s DataItemTableView property:
SORTING(Number) WHERE(Number=FILTER(1..))
…indicates that numbers 1 and up are being used (i.e. an open-ended set of integers starting at 1).
The use of an Integer table also usually means there is some C/AL code associated with it. In the case of DimensionLoop1, the primary code resides in two triggers:
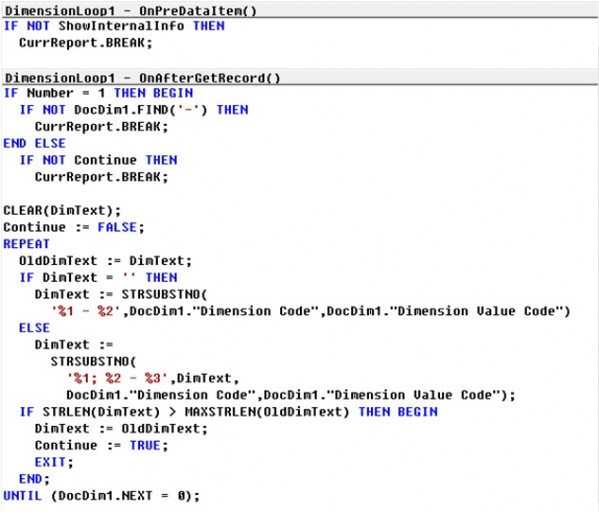
The code itself is fairly straightforward. In the OnPreDataItem trigger, we determine whether to process DimensionLoop1 based on whether we’ve selected the report’s Show Internal Information option. Only if the answer is yes do we proceed to the main body of the code, found in the OnAfterGetRecord trigger.
In this main trigger, the system queries DocDim1 to see if it has any records. If you check the C/AL globals, you will see that DocDim1 is a record variable for the Document Dimension table. It will naturally have lots of records, so it’s quite likely we’re filtering it somewhere, and, voila, we find the filtering code in the OnAfterGetRecord trigger of the Transfer Header data item, as follows:
DocDim1.SETRANGE(“Table ID”,DATABASE::”Transfer Header”);DocDim1.SETRANGE(“Document No.”,”Transfer Header”.”No.”);
In other words, for every Transfer Header record, we’re limiting the Document Dimension table to those records with a Table ID matching the Transfer Header table, and a Document No. matching the Transfer Header No. of the transfer order we are currently processing.
What are we doing with this subset of DocDim1 records? We’re building a text string using DocDim1’s Dimension Code and Dimension Value Code fields, and storing said text string in the global variable DimText. And here is the only little twist in this block of code: if we end up with more 75 characters of text (the maximum length for the global variable OldDimText), the code processes a second record in DimensionLoop1 (and possibly more), which explains why it was filtered to be an open-ended list of integers. If we do end up processing additional records in DimensionLoop1, that means our final dataset – the one being passed to the RDLC report – will end up with additional header dimension rows, which makes perfect sense, since the number of dimensions associated with a transfer order (or any document, for that matter) can vary significantly.
The same approach is taken with the DimensionLoop2 data item, except it focuses on line dimensions.
So, what have we gained from this analysis? On the one hand, it appears we’re building simple text strings to hold dimension data. That shouldn’t pose a conversion problem. On the other hand, because the number of dimensions associated with Transfer Header and Transfer Line records may vary considerably, we might end up with multiple additional records in our RDLC dataset. And because we are always dealing with a flattened dataset (see Converting Dynamics NAV Classic Reports To RDLC – Part 1 to understand why), this means we may end up with multiple additional records that are only partly formed, i.e. where some records have transfer header dimension values and nothing else, while others will have transfer line and line dimension values, but no header dimension values. Where more than one line dimension row is generated, we’ll also have repeats of the associated transfer line values. (If you don’t understand what we’re saying in this paragraph, you need to do some additional homework on how RDLC datasets are generated. of this series will help, but if you’re still struggling, email us at our blog site and we’ll try to answer your questions promptly.)
This realization that the contents of our RDLC dataset may be significantly altered by the Show Internal Information option is worth the preceding analysis all on its own. But now let’s carry the analysis forward by looking at the classic report’s section designer.
The Classic Report’s Handling of Dimensions in the Section Designer
Let’s again refer to the image of the classic report’s section designer:
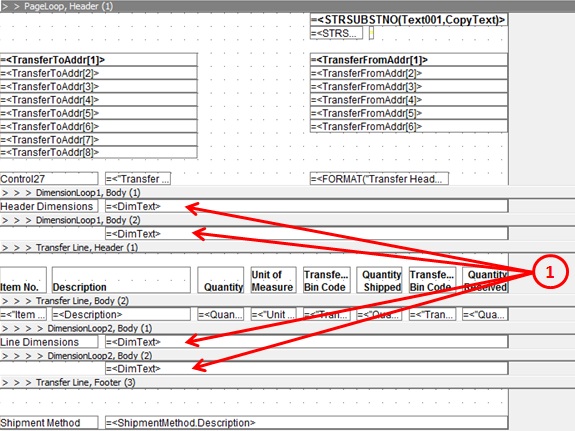
As you can see, sections for the header dimensions and line dimensions have not only been created; there are two body sections for each of them. Why two body sections for each? This is simply a labeling issue. If you look at the C/AL code for the first body section of DimensionLoop1, you will see the following:
CurrReport.SHOWOUTPUT(Number = 1);
So, this first section, which contains the label “Header Dimensions”, is only output when the Number field equals 1, i.e. for the first header dimension record. And if you look at the C/AL code in the second body section:
CurrReport.SHOWOUTPUT(Number > 1);
…you will see that it only prints for the second header dimension record onward.
This may seem like a relatively minor issue, but it’s actually more significant than it appears. First, this is conditional output. Second, the Create Layout Suggestion tool will ignore any C/AL created in the classic section designer. So, even if the conversion program had generated the dimension sections in the RDLC version of the report, you would still have to implement this conditional output somehow (i.e. provided you wanted the same behavior).
But that still doesn’t explain why the Create Layout Suggestion tool isn’t migrating your dimension sections in the first place. Could it be because there is C/AL code associated with the dimension sections? The answer is no. Go ahead – remove the C/AL code from the dimension sections and re-run the Create Layout Suggestion, and you will see it makes no difference.
It turns out that the reason your dimension sections are not participating in the RDLC section of the report has to do with this rather confounding logic:
After constructing the Page Header for your report, the Create Layout Suggestion tool then creates the Body of the report.
It’s main focus in creating the body is to construct a table.
When building a table, its effort seems to revolve around header sections.
In this case, the only header section in the body of the report is for the Transfer Line data item.
Because none of the caption fields from our DimensionLoop data items participate in that header section, the sections are excluded from the RDLC layout (though their fields do make it through to the RDLC dataset).
Don’t believe it? Add a header section for one of your dimension data items, put a caption into it for one of the data item fields (it will have to be the Number caption), or forego adding the extra header section, and add the caption directly to the Transfer Line Header section, then re-run the Create Layout Suggestion tool again, and you will see a dramatically different RDLC layout. It probably won’t be what you want, but it will be different.
The moral of this story is that Create Layout Suggestion’s build-the-body-table-around-the-header approach is okay for simple list reports, but it breaks down quickly in the face of greater complexity, meaning, when it comes to document reports, you will need to significantly restructure your RDLC layout manually.
Next Post
In the next post, we’ll apply all the knowledge we gained in this post and finally make our RDLC version of Report 5703 – Transfer Order fully functional.
Preceding Posts In This Series
In Part 1 of this series of posts, we examined the underlying technologies behind RDLC reporting. In Part 2, we looked at the basic process of converting Dynamics NAV classic reports to an RDLC layout.
Since then, we’ve been working through the specific issues you will encounter during the conversion process.
Since part 5, we’ve been walking through the conversion of Report 5703 – Transfer Order as an example of the issues you’ll face in converting a document report – the type of report likely to pose your biggest challenge in transitioning to RDLC layouts. This is the last post you will need to follow in order to complete the conversion of this specific report.
Aligning Your Classic Dataset and Your RDLC Table Structure
In Converting Dynamics NAV Classic Reports To RDLC – Part 9 of this series, we examined both the classic dataset and RDLC table structure that resulted from the Create Layout Suggestion process for Report 5703 – Transfer Order, and we found that the two were not in sync.
Indeed, it might be argued that synchronizing your classic dataset and your RDLC table structure is the most important task in the conversion process.
As with any conversion effort, it is important to understand both the source and target of the conversion. For this report, when the Show Internal Information checkbox is selected, and the number of dimension rows associated with the each order header record is 2, and the number of dimension rows associated with each order detail record is 3, the theoretical flattened source data structure is:
Header 1 Fields + Header 1 Dim. Row 1 Fields + Blank Detail Fields + Blank Detail Dim. FieldsHeader 1 Fields + Header 1 Dim. Row 2 Fields + Blank Detail Fields + Blank Detail Dim. FieldsHeader 1 Fields + Blank Header Dim. Fields + Detail 1 Fields + Detail 1 Dim. Row 1 FieldsHeader 1 Fields + Blank Header Dim. Fields + Detail 1 Fields + Detail 1 Dim. Row 2 FieldsHeader 1 Fields + Blank Header Dim. Fields + Detail 1 Fields + Detail 1 Dim. Row 3 FieldsHeader 1 Fields + Blank Header Dim. Fields + Detail 2 Fields + Detail 2 Dim. Row 1 FieldsHeader 1 Fields + Blank Header Dim. Fields + Detail 2 Fields + Detail 2 Dim. Row 2 FieldsHeader 1 Fields + Blank Header Dim. Fields + Detail 2 Fields + Detail 2 Dim. Row 3 Fields
This leaves us with two potential subsets of records within our flattened dataset:
- Order header fields plus populated header dimension fields plus blank detail and detail dimension fields
- Order header fields plus blank header dimension fields plus populated detail and detail dimension fields
Depending on the report options and the underlying data, this report might encounter many other variations, as well, including the complete absence of dimension rows at either the order header or order detail level.
So what kind of RDLC table structure do we need to accommodate this somewhat complex situation?
First, with the potential for a one-to-many subset of header dimensional records on the same level as the the one-to-many subset of order detail records (i.e. both linked directly to order header records and thus at the same level in the data hierarchy), your gut instinct should tell you that you need two tables, not one.
Listen to your gut and add a new table. Position this new table above your existing table, so it is the first reporting object in the report’s body section.
This new table will contain only a detail row (no table or group header or footer rows) with fields for the order header dimension records, as can be seen here in Microsoft’s RDLC layout for Report 5703 – Transfer Order:
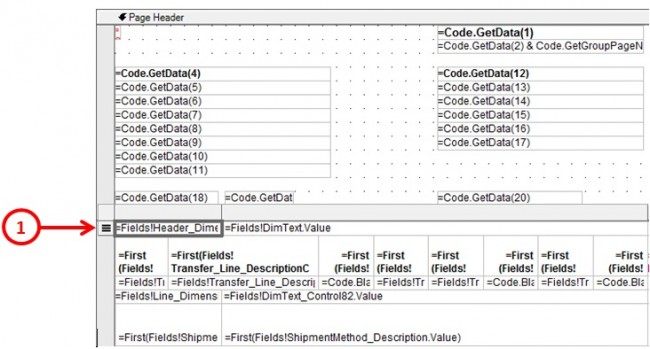
There is no magic to this new table. It simply prints the Header_DimensionsCaption and DimText fields that originate from the classic version of the report. However, you will need to perform a couple of actions to make it work properly in your own report (i.e. in addition to adding the new table and detail row, adding two Textboxes to the detail row, and connecting them to the Header_DimensionsCaption and DimText fields).
First, you need to return to the classic version of your report and add two new hidden TextBoxes:
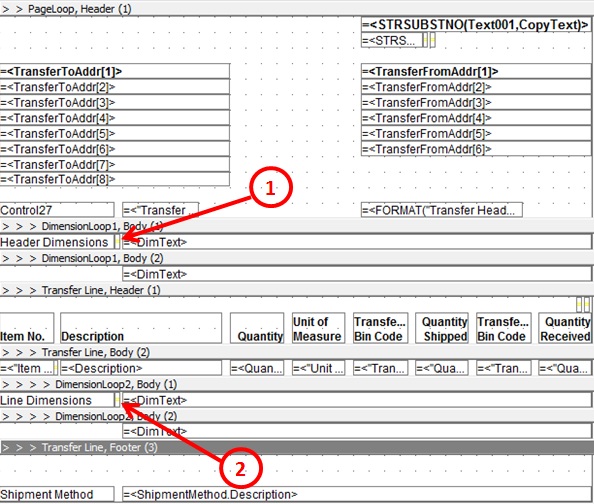
- The first hidden TextBox references the DimensionLoop1.Number data field (i.e. the Number field from the DimensionLoop1 instance of the Integer table).
- The second hidden TextBox references the DimensionLoop2.Number data field (i.e. the Number field from the DimensionLoop2 instance of the Integer table).
As you should know by now, the reason we’re placing these hidden Textboxes in sections of our classic report is to ensure that the data fields they reference make it into our RDLC dataset.
What will we do with these data fields on the RDLC side? We’ll use them as follows:
- On the Visibility tab of your new table, make visibility conditional on this expression:
- On the table properties’ Filters tab, set the following filter condition:
- A table header row containing the column headings
- A group header row containing the transfer order detail fields
- A detail row containing the order detail dimension records
- A table footer row containing the Shipment Method caption and description
- RDLC datasets are subsets of the classic datasets, restricted to the set of fields that are placed on the classic sections.
- For performance reasons, you’re better to filter data on the classic side of the equation wherever possible.
- You’re advised to avoid placing any data-related code in the classic section triggers.
- Extract and utilize NAV data using queries and reports
- Use the integrated debugger, the .NET interface, and C/AL extensions for automated testing
- Understand NAV’s data element choices, properties, and usages
- Discover how to successfully deliver an interactive user data presentation
- Sharpen your skills and increase your productivity with Microsoft Dynamics NAV
- Get to grips with the fundamental programming and design concepts of Microsoft Dynamics NAV 2015
IIf(Fields!DimensionLoop1_Number.Value > 0,False,True)
This ensures our new table will only show if there is header dimension data.
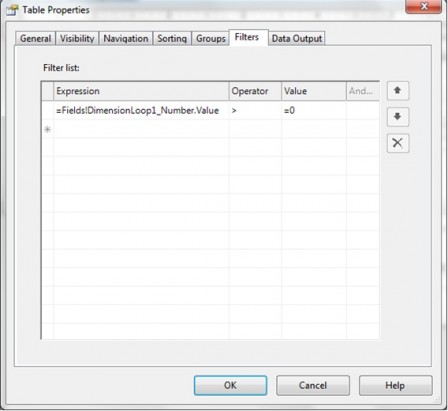
This ensures that only valid header dimension data is processed by the table (i.e. it filters out all records in the dataset that weren’t generated from DimensionLoop1).
Within the table, you also need to apply a visibility expression to the TextBox in the table’s first column, i.e. the one that displays the Header_DimensionsCaption field. The expression is:
=IIF(Fields!DimensionLoop1_Number.Value = 1,False,True)
This ensures that the header dimension caption displays only once, for the first header dimension row.
The main table in the Microsoft RDLC version of Report 5703 – Transfer Order appears as follows:
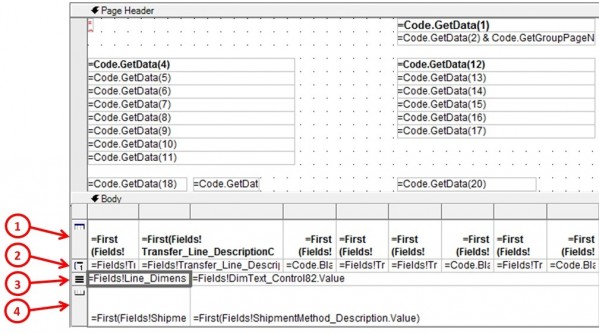
The rows in this table consist of:
There is very little RDLC magic to this table, either, as all the data rows/fields already flow through to the RDLC dataset from the classic report. The steps required to recreate this table structure in your own report are:
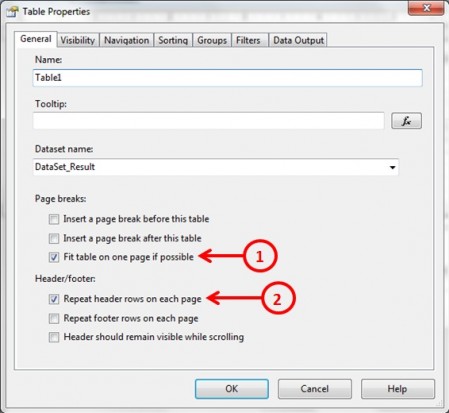
1. In the table properties, navigate to the General tab and set the values as shown:
2. Add a table header row.
3. Move the column headings from your existing group header row into the new table header row.
4. Move the data fields from your existing details row into your existing group header row.
5. Edit the General tab of the existing group header row to group on Transfer Header No., OutputNo, and Transfer Line No., as shown below:
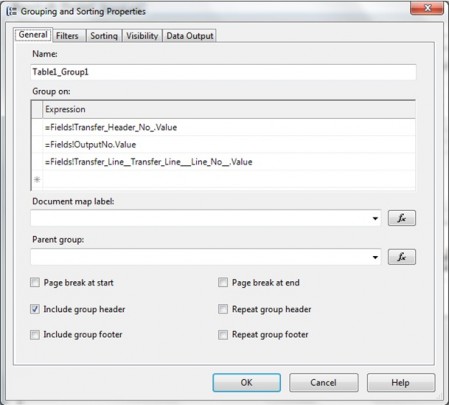
By grouping on these three fields, we eliminate the duplicates cause by using a flattened dataset.
6. Make sure your group is sorted on the same three fields, in the same order, as you’re using for the filter.
7. Add the following visibility expression to your existing detail row:
=IIF(Fields!DimensionLoop2_Number.Value > 0,False,True)
8. Add TextBoxes to the detail row for the transfer line dimension caption and dimension value fields. Note, you will have to merge cells and adjust widths, and of course connect the TextBoxes to their source fields (which may have different names in your report than in ours).
9. Add the following visibility expression to the Textbox that contains the transfer line dimension caption (whatever its actual name):
=IIf(Fields!DimensionLoop2_Number.Value = 1,False,True)
…which ensures the caption will print only once.
10. Add a table footer row to your main table and move the shipment code fields (caption and value) previously in your group footer row into this new row. Again, you will have to merge cells and make some layout adjustments to get this right.
11. Delete your old group footer row (which should now be empty).
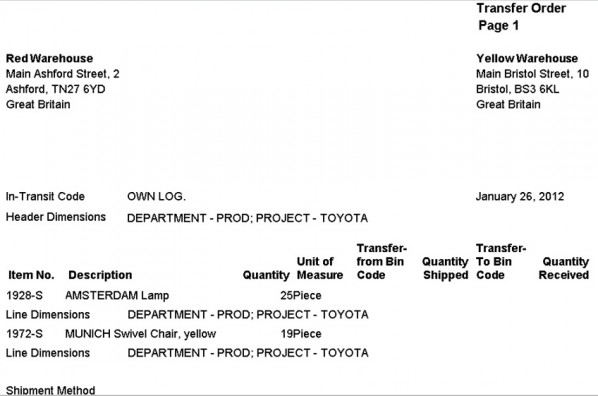
You will undoubtedly still have some layout tweaking to do, but if you have implemented all this correctly, your RDLC version of Report 5703 – Transfer Order should now be fully functional. Its output should look like this:
Next Post
We have a few more report types we’d like to cover in this series on converting classic reports to RDLC layouts, but we’ve come to realize that by lumping them all together, we’re making it difficult for people to find information on how to convert specific types of reports. So, going forward, were going to address each type of report conversion in its own post or series of posts.
About This Post
This is a beginner-level post on RDLC dataset structures. Its objective is to clarify the structural variances in datasets passed from NAV classic reports to their RDLC counterparts, and what has to be done on the RDLC side to properly handle these variances.
It also addresses one important exception, which is the need, for performance reasons, to generate only one copy of each picture data element per report (the reason for this will become clear shortly).
RDLC Datasets 101
The first thing to understand about RDLC datasets is that their field definitions currently depend on the placement of fields in the classic section designer. Therefore, if you create a report using one table that contains five fields, and you place only three of these fields in a section in the classic report, your RDLC dataset will only consist of the three fields you placed. This fact often leads programmers to place hidden fields in their classic report sections just so they can have access to those fields on the RDLC side.
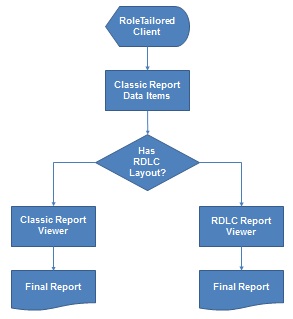
The second thing to remember about RDLC datasets is that they are built from classic data items using the traditional nested loop approach to data processing, and are handed off as flattened datasets to the RDLC report as per this diagram,which is borrowed from an earlier post on converting classic reports to RDLC:
This means that if you’re going to filter your report data, you should attempt to do it on the classic side of the equation wherever possible. Otherwise, you may be bringing data over to your client that isn’t needed.
There’s also a third general caveat about these datasets. You can currently affect the datasets by placing C/AL code in the triggers for classic sections (i.e. in addition to any code you place in the data item triggers). Avoid using section code at all costs, as the classic sections no longer exist as of NAV 2013, so any functionality you build into them will eventually be lost.
So, keep in mind that
You are now officially a graduate of RDLC Datasets 101.
The Header-Detail Model
The simplest data model is of course the one-table model, but it needs no explanation, so let’s start with a typical header-detail model:
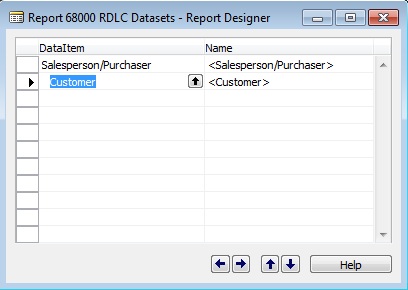
You might use a structure like this when building a report showing customer data for each sales rep, say, sales by customer per sales rep. In this data item model, the Customer table is indented to the Salesperson/Purchaser table, which means the set of fields from the Customer table will be appended to the set of fields from the Salesperson/Purchaser table in the flattened RDLC dataset.
Using a simple model of Code and Name from the Salesperson/Purchaser table, and No. and Name from the Customer table, here is the dataset that you’ll get on the RDLC side:
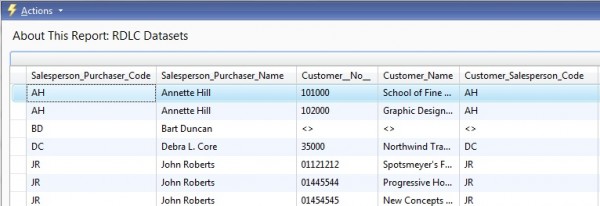
Because the dataset has been flattened, the Salesperson_Purchaser_Code and Salesperson_Purchaser_Name repeat for every customer record for that sales rep.
Note, also, that where no customers exist for a sales rep (as in the case of lonely Bart Duncan), the customer fields are blank.
Wondering where I’m getting this fabulous preview of the data in my RDLC dataset that lets me see exactly what’s going on? Just click the About This Report option in the upper right hand corner of the RDLC report viewer. You’ll have to do this twice (meaning you’ll have to run the report twice), first to activate this feature, second to use it, but it’s well worth this minor inconvenience.
So, how do you handle the above data structure on the RDLC side, especially if you’d like the sales rep data to be printed only once per rep?
You group the data like this (i.e. in this extremely simple report layout):
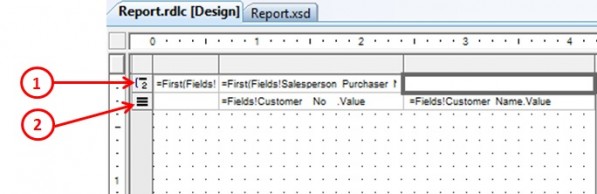
The data in this case is inside a table object consisting of two rows.
The first row is a group header row. You use this type of row on the sales rep fields so you can group the multiple instances of each salesrep into one instance, as per this group expression:
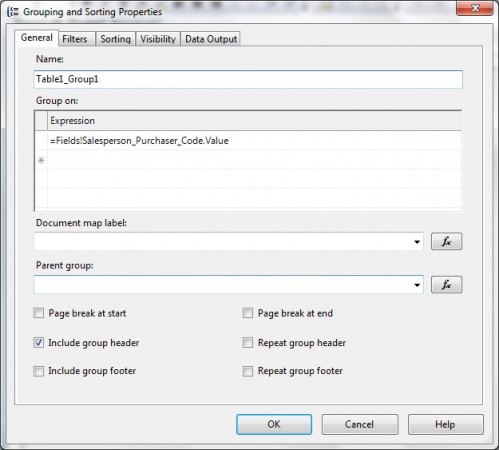
The second table row is simply a details row, which contains the true details of your report – the customer data. And that’s it. By using a group header table row (if you’re using a table object), and grouping on the sales rep code, you’re essentially de-flattening the flattened dataset you were handed.
The only caveat with this technique is to make sure that, in addition to indenting detail tables in classic report designer, you also restrict them via the DataItemLink property to their parent table (in this case, ensuring that the only customers presented for a sales rep are the ones that share that sales rep’s code). Otherwise, you’ll end up with what’s known in the database world as the Cartesian product (a combination of each parent record with all possible detail records), which, if the report you’re running is big enough, could result in your untimely death at the hands of either the database administrator or the person in charge of buying printer paper.
The Header-Multiple Detail Model
So, what if you’re feeling really ambitious and want to produce a report that shows sales data for each rep not only by customer, but by item, too, giving you a classic data item structure like this (in this case, the sales data in the Sales Header/Line tables is grouped and totaled on item):
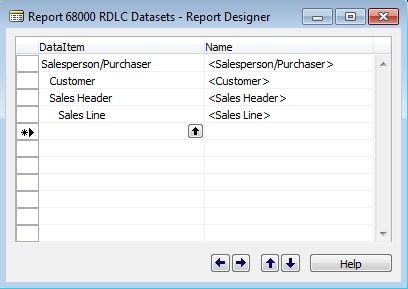
Notice how the Customer and Sales Header tables are on the same indentation level?
This will produce the following data structure:
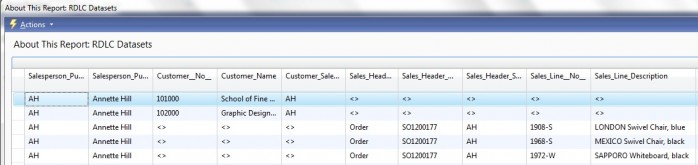
If you look closely, you will see that, although we’re still receiving one flattened dataset, it’s actually two distinct data sets lumped together, one with sales rep data combined with customer data; the other with sales rep data combined with item sales data.
Because we have two distinct data sets, we need two different “structures” on the RDLC side to hold them. In this case, I’ll use a List object that contains 1) text boxes for the sales rep data, 2) a table for the customer-related data, 3) a second table for the item sales data.
Because I’m using tables for each subset of data, I can then set table filters, as shown here to filter the item sales data:
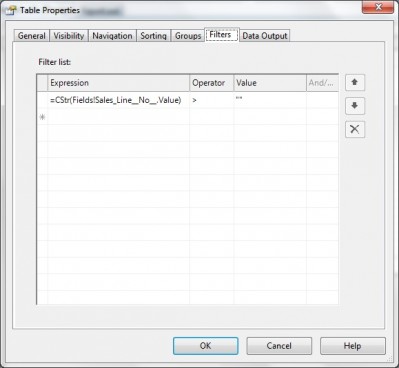
This simple filter says, please only give me records that have something other than a blank value in the Sales Line No. field – in other words, the subset of item sales data.
Similarly, for the customer table, our table filter will filter out all the records other than the ones that have customer data.
Filter, Group, Filter, Group…
I could make this post nauseatingly long by showing you lots of other variations in RDLC datasets, but the principles for managing them are always the same: use filters and/or groups in combination with the appropriate RDLC reporting objects.
There is one situation worthy of special mention, however…
Beware the RDLC Blob
According to an old saying, a picture is worth a thousand words.
Unfortunately, when you’re dealing with flattened datasets, it can also be worth a giant performance headache. Imagine, for example, a report where you want to present information on the company’s sales reps with lots of bio information about the sales rep in the report header, including each rep’s photograph, followed by sales data in excruciating detail in the body of the report (as in lots of detail records). If each photograph is 1 megabyte, and there are 100 detail records for each sales rep (all joined to your sales rep data in some manner), you just bought yourself 99 megabytes of unwanted photograph data per sales rep.
Over on Waldo’s blog, which you will find is always worth a visit, he wrote about this a few weeks ago. To summarize his initial solution, he created an Integer table with one record at the same level as his top-level item, thereby creating two distinct subsets of data within his flattened dataset. In the section designer, he then moved the picture field into the design section for the Integer table, meaning the photo was produced only once for that report (see Waldo’s full blog on this here NAV 2009 RDLC Reporting: Working With Multiple Datasets).
This becomes trickier, however, when you have multiple records with pictures in the header portion of your dataset.
One of Waldo’s readers wrote in with a different solution, suggesting to eliminate duplicate photos by clearing the picture fields, i.e. CLEAR(NameOfPictureField), in the OnPreDataItem trigger of the data item immediately following the one containing the photo. This solution is described in this post: NAV 2009 RDLC Reporting: OutOfMemoryException When Printing An RDLC Report – Solution.
I was not successful in applying this exact solution in my data structure, but that could be entirely my failing. However, I was successful in applying the principle of this solution by using a little more explicit coding in the detail table’s OnAfterGetRecord trigger, where I cleared the variable holding the picture only after the first detail record had been successfully processed.
Hope this helps. If you have any questions, feel free to post them.

David Studebaker is the Chief Technical Officer and a cofounder of Liberty Grove Software. Dave has had a wide range of development, consulting, sales and management roles throughout his career. He has been a partner or owner and manager of several software development businesses while always maintaining a significant role as a business application developer.
Along with his son, Chris, Dave has completed Programming Microsoft Dynamics™ NAV 2015, following up on his previous series of development books starting with NAV 5 and continuing with NAV 2009 and NAV 2013.
This book is ideal for a NAV developer or designer of business applications. It assumes that you have a basic understanding of business management systems and application development with working knowledge of Microsoft Dynamics NAV.
What You Will Learn
Programming Microsoft Dynamics NAV 2015 can be purchased here at PACKT and here at Amazon.

Liberty Grove Software has just returned from another great NAVUG Summit in Reno. This is an excellent event for the users to get together to learn more about NAV, ISVs for NAV, and how others use NAV. It is the type of event where you come with your challenges and you leave with options and possibilities. These come from your peers, partners and other experts.
You get opportunities to find out about What’s New in NAV plus how to work with current versions.

Thank you for supporting these dedicated authors. We are offering a 50% off discount for the following ebooks until November 12, 2015.
Use discount code: LGNav50
Programming Microsoft Dynamics™ NAV 2015