Dynamics NAV 2009 RDLC Datasets
About This Post
This is a beginner-level post on RDLC dataset structures. Its objective is to clarify the structural variances in datasets passed from NAV classic reports to their RDLC counterparts, and what has to be done on the RDLC side to properly handle these variances.
It also addresses one important exception, which is the need, for performance reasons, to generate only one copy of each picture data element per report (the reason for this will become clear shortly).
RDLC Datasets 101
The first thing to understand about RDLC datasets is that their field definitions currently depend on the placement of fields in the classic section designer. Therefore, if you create a report using one table that contains five fields, and you place only three of these fields in a section in the classic report, your RDLC dataset will only consist of the three fields you placed. This fact often leads programmers to place hidden fields in their classic report sections just so they can have access to those fields on the RDLC side.
The second thing to remember about RDLC datasets is that they are built from classic data items using the traditional nested loop approach to data processing, and are handed off as flattened datasets to the RDLC report as per this diagram,which is borrowed from an earlier post on converting classic reports to RDLC:
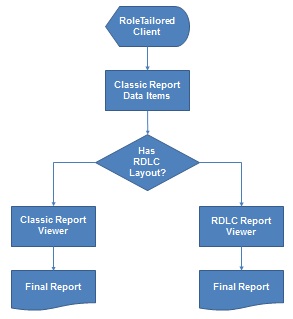
This means that if you’re going to filter your report data, you should attempt to do it on the classic side of the equation wherever possible. Otherwise, you may be bringing data over to your client that isn’t needed.
There’s also a third general caveat about these datasets. You can currently affect the datasets by placing C/AL code in the triggers for classic sections (i.e. in addition to any code you place in the data item triggers). Avoid using section code at all costs, as the classic sections no longer exist as of NAV 2013, so any functionality you build into them will eventually be lost.
So, keep in mind that
- RDLC datasets are subsets of the classic datasets, restricted to the set of fields that are placed on the classic sections.
- For performance reasons, you’re better to filter data on the classic side of the equation wherever possible.
- You’re advised to avoid placing any data-related code in the classic section triggers.
You are now officially a graduate of RDLC Datasets 101.
The Header-Detail Model
The simplest data model is of course the one-table model, but it needs no explanation, so let’s start with a typical header-detail model:
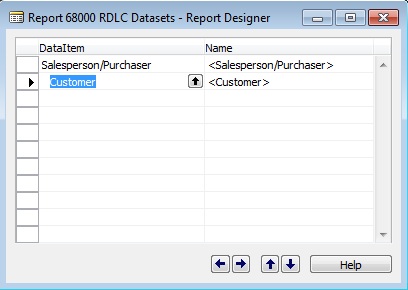
You might use a structure like this when building a report showing customer data for each sales rep, say, sales by customer per sales rep. In this data item model, the Customer table is indented to the Salesperson/Purchaser table, which means the set of fields from the Customer table will be appended to the set of fields from the Salesperson/Purchaser table in the flattened RDLC dataset.
Using a simple model of Code and Name from the Salesperson/Purchaser table, and No. and Name from the Customer table, here is the dataset that you’ll get on the RDLC side:
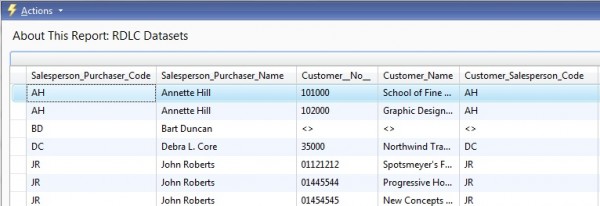
Because the dataset has been flattened, the Salesperson_Purchaser_Code and Salesperson_Purchaser_Name repeat for every customer record for that sales rep.
Note, also, that where no customers exist for a sales rep (as in the case of lonely Bart Duncan), the customer fields are blank.
Wondering where I’m getting this fabulous preview of the data in my RDLC dataset that lets me see exactly what’s going on? Just click the About This Report option in the upper right hand corner of the RDLC report viewer. You’ll have to do this twice (meaning you’ll have to run the report twice), first to activate this feature, second to use it, but it’s well worth this minor inconvenience.
So, how do you handle the above data structure on the RDLC side, especially if you’d like the sales rep data to be printed only once per rep?
You group the data like this (i.e. in this extremely simple report layout):

The data in this case is inside a table object consisting of two rows.
The first row is a group header row. You use this type of row on the sales rep fields so you can group the multiple instances of each salesrep into one instance, as per this group expression:
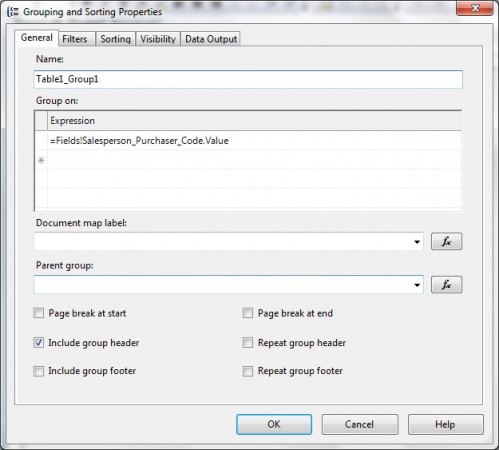
The second table row is simply a details row, which contains the true details of your report – the customer data. And that’s it. By using a group header table row (if you’re using a table object), and grouping on the sales rep code, you’re essentially de-flattening the flattened dataset you were handed.
The only caveat with this technique is to make sure that, in addition to indenting detail tables in classic report designer, you also restrict them via the DataItemLink property to their parent table (in this case, ensuring that the only customers presented for a sales rep are the ones that share that sales rep’s code). Otherwise, you’ll end up with what’s known in the database world as the Cartesian product (a combination of each parent record with all possible detail records), which, if the report you’re running is big enough, could result in your untimely death at the hands of either the database administrator or the person in charge of buying printer paper.
The Header-Multiple Detail Model
So, what if you’re feeling really ambitious and want to produce a report that shows sales data for each rep not only by customer, but by item, too, giving you a classic data item structure like this (in this case, the sales data in the Sales Header/Line tables is grouped and totaled on item):
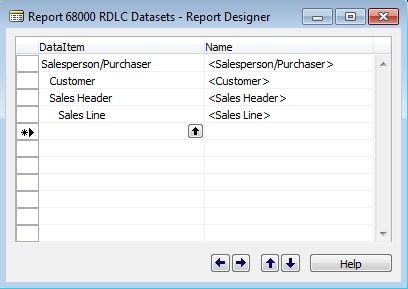
Notice how the Customer and Sales Header tables are on the same indentation level?
This will produce the following data structure:

If you look closely, you will see that, although we’re still receiving one flattened dataset, it’s actually two distinct data sets lumped together, one with sales rep data combined with customer data; the other with sales rep data combined with item sales data.
Because we have two distinct data sets, we need two different “structures” on the RDLC side to hold them. In this case, I’ll use a List object that contains 1) text boxes for the sales rep data, 2) a table for the customer-related data, 3) a second table for the item sales data.
Because I’m using tables for each subset of data, I can then set table filters, as shown here to filter the item sales data:
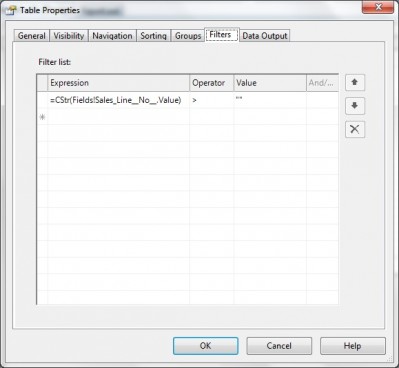
This simple filter says, please only give me records that have something other than a blank value in the Sales Line No. field – in other words, the subset of item sales data.
Similarly, for the customer table, our table filter will filter out all the records other than the ones that have customer data.
Filter, Group, Filter, Group…
I could make this post nauseatingly long by showing you lots of other variations in RDLC datasets, but the principles for managing them are always the same: use filters and/or groups in combination with the appropriate RDLC reporting objects.
There is one situation worthy of special mention, however…
Beware the RDLC Blob
According to an old saying, a picture is worth a thousand words.
Unfortunately, when you’re dealing with flattened datasets, it can also be worth a giant performance headache. Imagine, for example, a report where you want to present information on the company’s sales reps with lots of bio information about the sales rep in the report header, including each rep’s photograph, followed by sales data in excruciating detail in the body of the report (as in lots of detail records). If each photograph is 1 megabyte, and there are 100 detail records for each sales rep (all joined to your sales rep data in some manner), you just bought yourself 99 megabytes of unwanted photograph data per sales rep.
Over on Waldo’s blog, which you will find is always worth a visit, he wrote about this a few weeks ago. To summarize his initial solution, he created an Integer table with one record at the same level as his top-level item, thereby creating two distinct subsets of data within his flattened dataset. In the section designer, he then moved the picture field into the design section for the Integer table, meaning the photo was produced only once for that report (see Waldo’s full blog on this here NAV 2009 RDLC Reporting: Working With Multiple Datasets).
This becomes trickier, however, when you have multiple records with pictures in the header portion of your dataset.
One of Waldo’s readers wrote in with a different solution, suggesting to eliminate duplicate photos by clearing the picture fields, i.e. CLEAR(NameOfPictureField), in the OnPreDataItem trigger of the data item immediately following the one containing the photo. This solution is described in this post: NAV 2009 RDLC Reporting: OutOfMemoryException When Printing An RDLC Report – Solution.
I was not successful in applying this exact solution in my data structure, but that could be entirely my failing. However, I was successful in applying the principle of this solution by using a little more explicit coding in the detail table’s OnAfterGetRecord trigger, where I cleared the variable holding the picture only after the first detail record had been successfully processed.
Hope this helps. If you have any questions, feel free to post them.

